File:Mouse 3D Heart external E8.5-14.5.jpeg: Difference between revisions
No edit summary |
No edit summary |
||
| Line 6: | Line 6: | ||
Fig. 2. H71230363002.jpeg | Fig. 2. H71230363002.jpeg | ||
{| class="prettytable" | |||
| Species | |||
| '''Stage''' | |||
| <center>'''9'''</center> | |||
| <center>'''10'''</center> | |||
| <center>'''11'''</center> | |||
| <center>'''12'''</center> | |||
| <center>'''13'''</center> | |||
| <center>'''14'''</center> | |||
| <center>'''15'''</center> | |||
| <center>'''16'''</center> | |||
| <center>'''17'''</center> | |||
| <center>'''18'''</center> | |||
| <center>'''19'''</center> | |||
| <center>'''20'''</center> | |||
| <center>'''21'''</center> | |||
| <center>'''22'''</center> | |||
| <center>'''23'''</center> | |||
|- | |||
| Human | |||
| Days | |||
| 20 | |||
| 22 | |||
| 24 | |||
| 28 | |||
| 30 | |||
| 33 | |||
| 36 | |||
| 40 | |||
| 42 | |||
| 44 | |||
| 48 | |||
| 52 | |||
| 54 | |||
| 55 | |||
| 58 | |||
|- | |||
| Mouse | |||
| Days | |||
| 9 | |||
| 9.5 | |||
| 10 | |||
| 10.5 | |||
| 11 | |||
| 11.5 | |||
| 12 | |||
| 12.5 | |||
| 13 | |||
| 13.5 | |||
| 14 | |||
| 14.5 | |||
| 15 | |||
| 15.5 | |||
| 16 | |||
|} | |||
Image (used with permission) from the paper Soufan AT, Ruijter JM, van den Hoff MJ, de Boer PA, Hagoort J, Moorman AF. Three-dimensional reconstruction of gene expression patterns during cardiac development. Physiol Genomics. 2003 May 13;13(3):187-95. (Physiol Genomics paper) | Image (used with permission) from the paper Soufan AT, Ruijter JM, van den Hoff MJ, de Boer PA, Hagoort J, Moorman AF. Three-dimensional reconstruction of gene expression patterns during cardiac development. Physiol Genomics. 2003 May 13;13(3):187-95. (Physiol Genomics paper) | ||
Three-dimensional reconstruction of gene expression patterns during cardiac development. Soufan AT, Ruijter JM, van den Hoff MJ, de Boer PA, Hagoort J, Moorman AF. Physiol Genomics. 2003 May 13;13(3):187-95. Review. [http://www.ncbi.nlm.nih.gov/pubmed/12746463 PMID: 12746463] | Three-dimensional reconstruction of gene expression patterns during cardiac development. Soufan AT, Ruijter JM, van den Hoff MJ, de Boer PA, Hagoort J, Moorman AF. Physiol Genomics. 2003 May 13;13(3):187-95. Review. [http://www.ncbi.nlm.nih.gov/pubmed/12746463 PMID: 12746463] | ||
Revision as of 21:57, 16 August 2009
Mouse 3D Heart external E8.5-14.5
Reconstructions of the myocardium of embryonic mouse hearts ranging from embryonic day 8.5 to 14.5 (ED 8.5 to 14.5).
All hearts are drawn at the same magnification (grid size: 500 x 500 µm). The increase of the myocardium volume is plotted as a curved line (y-axis in mm3). Note the similarity between the duplicate hearts at ED 9.5 and 10.5.
Fig. 2. H71230363002.jpeg
| Species | Stage | |||||||||||||||
| Human | Days | 20 | 22 | 24 | 28 | 30 | 33 | 36 | 40 | 42 | 44 | 48 | 52 | 54 | 55 | 58 |
| Mouse | Days | 9 | 9.5 | 10 | 10.5 | 11 | 11.5 | 12 | 12.5 | 13 | 13.5 | 14 | 14.5 | 15 | 15.5 | 16 |
Image (used with permission) from the paper Soufan AT, Ruijter JM, van den Hoff MJ, de Boer PA, Hagoort J, Moorman AF. Three-dimensional reconstruction of gene expression patterns during cardiac development. Physiol Genomics. 2003 May 13;13(3):187-95. (Physiol Genomics paper)
Three-dimensional reconstruction of gene expression patterns during cardiac development. Soufan AT, Ruijter JM, van den Hoff MJ, de Boer PA, Hagoort J, Moorman AF. Physiol Genomics. 2003 May 13;13(3):187-95. Review. PMID: 12746463
File history
Yi efo/eka'e gwa ebo wo le nyangagi wuncin ye kamina wunga tinya nan
| Gwalagizhi | Nyangagi | Dimensions | User | Comment | |
|---|---|---|---|---|---|
| current | 21:48, 16 August 2009 | 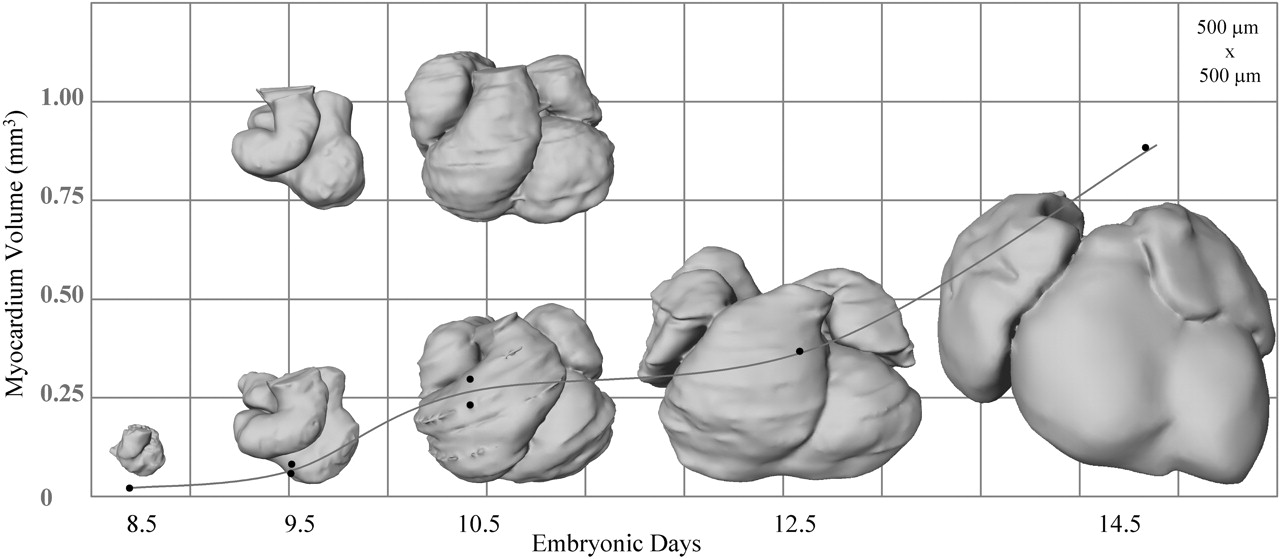 | 1,280 × 559 (90 KB) | S8600021 (talk | contribs) | Mouse 3D Heart external E8.5-14.5 Reconstructions of the myocardium of embryonic mouse hearts ranging from embryonic day 8.5 to 14.5 (ED 8.5 to 14.5). All hearts are drawn at the same magnification (grid size: 500 x 500 µm). The increase of the myocard |
You cannot overwrite this file.
File usage
The following 3 pages use this file:


