File:Fragile X syndrome EEG analysis method.jpg
Original file (1,000 × 728 pixels, file size: 159 KB, MIME type: image/jpeg)
Fragile X syndrome overview of method normalized graph analysis of the EEG time series
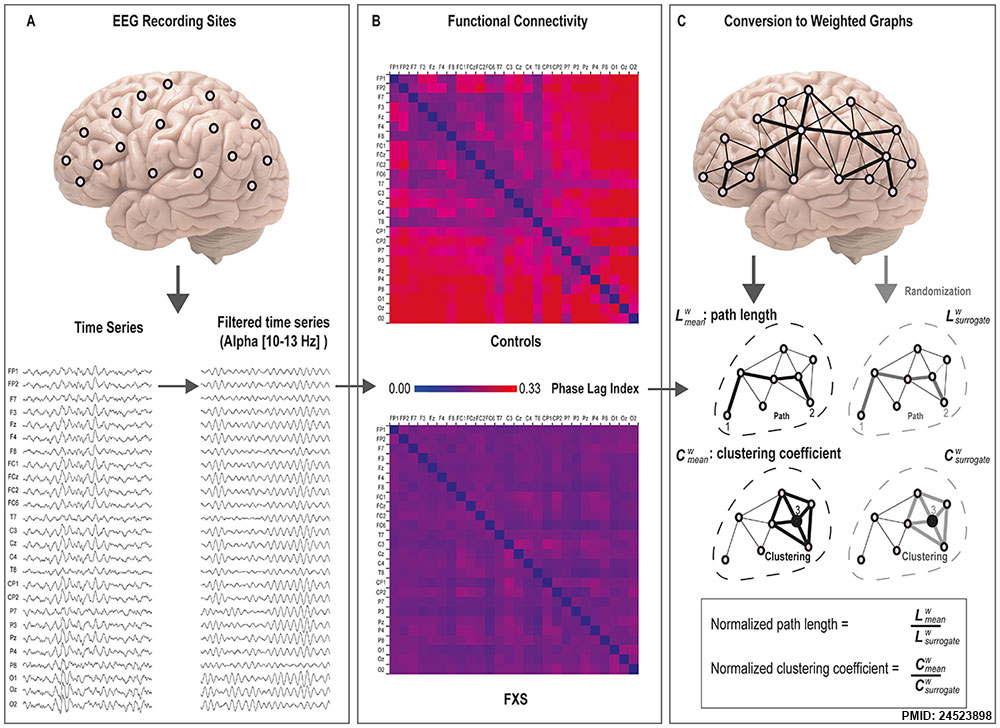
An overview of the method used to calculate weighted graphs.
- A - EEG time-series from the 26 scalp electrodes were separately filtered for the delta, theta, alpha low, alpha high, beta, and gamma frequency bands. Higher alpha (10–13 Hz) is shown here as largest group differences were found for this frequency band.
- B - Functional connectivity between all 26×26 electrode pairs was calculated based on the phase lag index, yielding connectivity values between 0 and 1 (higher values reflect more synchronization between electrodes).
- C - When using graph theoretical analysis on EEG time series, electrodes represent “nodes” and the distance between these nodes represent the “edges” in the graph. PLI scores were used to calculate the path length (distance between the nodes) and the clustering coefficients (the degree in which nodes cluster together). In addition, a randomization procedure is employed to obtain measures independent of network size. From each original graph, random networks were derived by randomly shuffling the edge weights. Mean values of weighted graphs are then determined by dividing the original graph measures by these ‘surrogate’ measures.
- BrainWave software v0.9.76 (developed by C.S.; freely available at http://home.kpn.nl/stam7883/brainwave.html).
- Links: Fragile X Syndrome
Reference
van der Molen MJ, Stam CJ & van der Molen MW. (2014). Resting-state EEG oscillatory dynamics in fragile X syndrome: abnormal functional connectivity and brain network organization. PLoS ONE , 9, e88451. PMID: 24523898 DOI.
Copyright
© 2014 van der Molen et al. This is an open-access article distributed under the terms of the Creative Commons Attribution License, which permits unrestricted use, distribution, and reproduction in any medium, provided the original author and source are credited.
Figure 1. Journal.pone.0088451.g001.jpg doi:10.1371/journal.pone.0088451.g001
Cite this page: Hill, M.A. (2024, April 26) Embryology Fragile X syndrome EEG analysis method.jpg. Retrieved from https://embryology.med.unsw.edu.au/embryology/index.php/File:Fragile_X_syndrome_EEG_analysis_method.jpg
- © Dr Mark Hill 2024, UNSW Embryology ISBN: 978 0 7334 2609 4 - UNSW CRICOS Provider Code No. 00098G
File history
Click on a date/time to view the file as it appeared at that time.
| Date/Time | Thumbnail | Dimensions | User | Comment | |
|---|---|---|---|---|---|
| current | 09:29, 21 February 2014 | | 1,000 × 728 (159 KB) | Z8600021 (talk | contribs) | ==Fragile X syndrome overview of method normalized graph analysis of the EEG time series== An overview of the method used to calculate weighted graphs. (A) EEG time-series from the 26 scalp electrodes were separately filtered for the delta, theta, alp... |
You cannot overwrite this file.
File usage
The following page uses this file: