Uploads by Z3329495
From Embryology
This special page shows all uploaded files.
| Date | Name | Thumbnail | Size | Description | Versions |
|---|---|---|---|---|---|
| 14:18, 9 October 2011 | Heart Hypertrophy gross.jpg (file) |  |
59 KB | Image shows a gross and microscopic section of mice heart with hypertrophy (left) and without (right). Left atrial thrombus visible on the left specimen. Masson trichrome–stained sections of wild-type and Hdac3cko mice at 12 weeks. Deletion of Hdac3 re | 1 |
| 09:36, 6 October 2011 | CT lungcancer.JPG (file) |  |
18 KB | A screen grab of a CT of a lung with cancer. Taken from: [http://www.youtube.com/watch?v=MLg-_fsaHso&feature=youtu.be|CT scan - Lung cancer] {{Template:2011 Student Image}} | 1 |
| 09:28, 6 October 2011 | MRI heart.JPG (file) |  |
14 KB | A screen grab of an MRI taken from: http://www.youtube.com/watch?v=G4dFVeP9Vdo&feature=youtu.be {{Template:2011 Student Image}} | 1 |
| 17:59, 3 October 2011 | Heart disection.jpg (file) |  |
209 KB | The gross specimen (left)shows the mildly dilated left ventricle(LV) with normal wall thickness; the walls were flabby. The microscopic section(right) from the left ventricular free wall shows marked connective tissue replacement. Small vessel coronary ar | 1 |
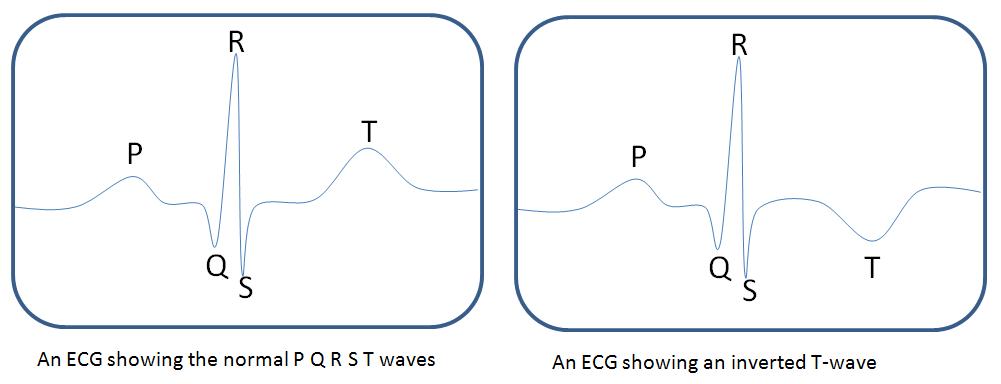
| 22:44, 16 September 2011 | Schematic ECG normal and inverted T-wave.jpg (file) |  |
32 KB | A student drawn schematic of an Electrocardiogram (ECG) with a normal ECG on the left and an ECG showing T-wave inversion on the right. Based off the image taken from here: http://en.wikipedia.org/wiki/File:SinusRhythmLabels.svg {{Template:2011 Student | 1 |
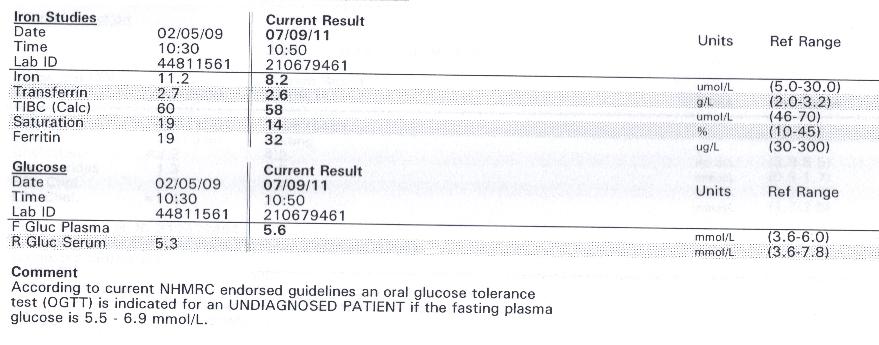
| 11:50, 11 September 2011 | Blood test result for glucose and iron.jpg (file) |  |
54 KB | Blood result for glucose and iron. Permission to upload and reproduce provided by the patient. Copyright: This image may not be reproduced outside of this wikipedia. {{Template:2011 Student Image}} | 1 |
| 16:12, 10 September 2011 | Blood test results.jpg (file) |  |
54 KB | Blood test result showing glucose and iron levels. Permission to upload and reproduce results provided by patient. Copyright: This image may not be reproduced outside of this wikipedia. {{Template:2011 Student Image}} | 1 |
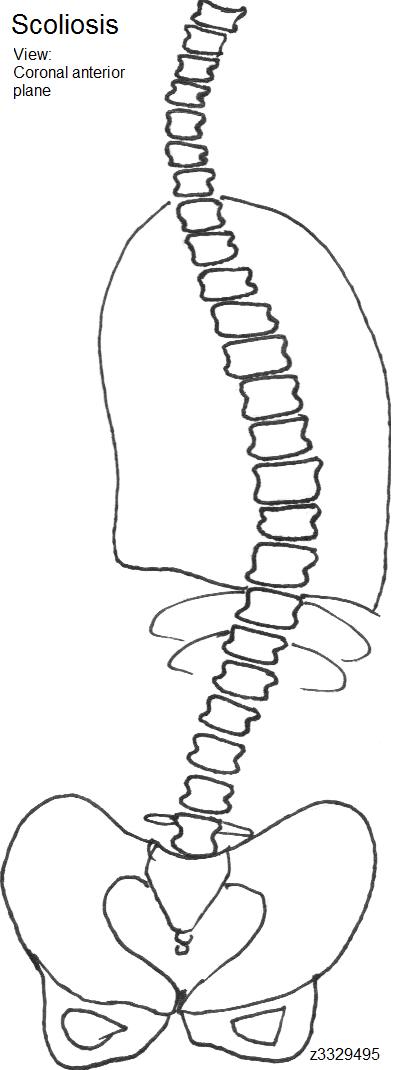
| 11:38, 27 August 2011 | Scoliosis drawn.jpg (file) |  |
43 KB | Student drawn sketch of scoliosis showing curving of spine in coronal plane from the anterior view. Copyright: uploaded and reproduced by the person who drew it. | 1 |
| 16:10, 25 August 2011 | Chelator and vehicle effect on hematological indices.png (file) |  |
72 KB | hematological indices shows that in the 4-week treatment RBC count, hemoglobin concentration and hematocrit did not decrease across both vehicle and chelator treated mice. Copyright: Anyone may, without requesting permission, use original figures or tab | 1 |
| 11:25, 16 August 2011 | Pathogenesis of Friedreich Ataxia.jpg (file) |  |
30 KB | Figure 5 Model of Friedreich's ataxia pathology based on this study. Data presented in this study are consistent with a dysregulation of mitochondrial function, decreased oxidative phosphorylation, increased ROS production, and subsequent mitochondrial an | 2 |