File:GAA Frequency in FRDA.jpg
From Embryology
GAA_Frequency_in_FRDA.jpg (622 × 345 pixels, file size: 37 KB, MIME type: image/jpeg)
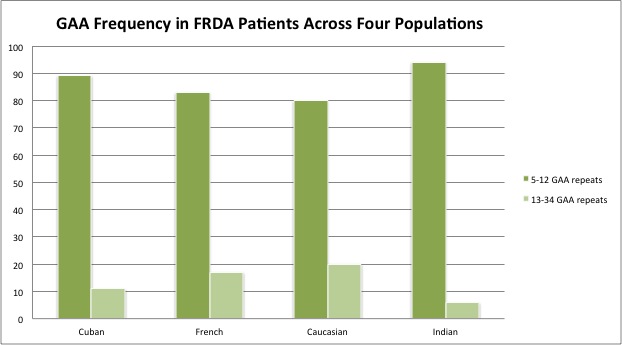
Graph of the Frequency of GAA Repeat in FRDA Patients across Four Different Populations
This graph provides a geographical analysis of the GAA repeat expansion in FRDA patients across four different populations.
Illustration: z3294943
The raw data was collect from the study by Marino et al (2010). [1]
References
- ↑ <pubmed>20569261</pubmed>
- Note - This image was originally uploaded as part of a student project and may contain inaccuracies in either description or acknowledgements. Students have been advised in writing concerning the reuse of content and may accidentally have misunderstood the original terms of use. If image reuse on this non-commercial educational site infringes your existing copyright, please contact the site editor for immediate removal.
Cite this page: Hill, M.A. (2024, April 27) Embryology GAA Frequency in FRDA.jpg. Retrieved from https://embryology.med.unsw.edu.au/embryology/index.php/File:GAA_Frequency_in_FRDA.jpg
- © Dr Mark Hill 2024, UNSW Embryology ISBN: 978 0 7334 2609 4 - UNSW CRICOS Provider Code No. 00098G
File history
Click on a date/time to view the file as it appeared at that time.
| Date/Time | Thumbnail | Dimensions | User | Comment | |
|---|---|---|---|---|---|
| current | 13:49, 7 October 2011 |  | 622 × 345 (37 KB) | Z3294943 (talk | contribs) | Graph of the Frequency of GAA Repeat in FRDA Patients across Four Different Populations |
You cannot overwrite this file.
File usage
The following 2 pages use this file:
