File:Cognitive performance in WS subjects (n = 67) versus normal controls.png: Difference between revisions
(http://www.plosone.org/article/info%3Adoi%2F10.1371%2Fjournal.pone.0010292 Copyright: © 2010 Gao et al. This is an open-access article distributed under the terms of the Creative Commons Attribution License, which permits unrestricted use, distribution,) |
No edit summary |
||
| Line 1: | Line 1: | ||
'''Cognitive Performance in WS Subjects (n = 67) versus normal controls''' | |||
a: Means (circles) and SD (bars) of WAIS-R subtest scores for WS cases. Performance subtests are listed in bold; verbal subtests in plain font. In normal controls (NC), WAIS-R subtest scores are 10±3 (thick gray line). b: Means (circles) and SD (bars) of VIQ, PIQ, and FSIQ scores for WS cases. In normal controls (NC), WAIS-R VIQ, PIQ, and FSIQ scores are 100±15 (thick gray line). c: Principal component analysis of WAIS-R shows subtests contribute differently to intelligence in WS cases versus normal controls. WAIS-R subtest loadings on PC1 in WS cases (x-axis) and normal controls (y-axis). Data used for normal analysis is from Enns and Reddon [27]. Performance subtests are listed in bold; verbal subtests in plain font. The iagonal line is x = y, at which WS and normal loadings are equal. | |||
http://www.plosone.org/article/info%3Adoi%2F10.1371%2Fjournal.pone.0010292 | http://www.plosone.org/article/info%3Adoi%2F10.1371%2Fjournal.pone.0010292 | ||
Copyright: © 2010 Gao et al. This is an open-access article distributed under the terms of the Creative Commons Attribution License, which permits unrestricted use, distribution, and reproduction in any medium, provided the original author and source are credited. | Copyright: © 2010 Gao et al. This is an open-access article distributed under the terms of the Creative Commons Attribution License, which permits unrestricted use, distribution, and reproduction in any medium, provided the original author and source are credited. | ||
_versus_normal_controls.png&oldid=74618)
_versus_normal_controls.png&action=edit&oldid=74618)
_versus_normal_controls.png&oldid=74620)
_versus_normal_controls.png&action=edit&oldid=74620)
_versus_normal_controls.png&diff=next&oldid=74620)
Revision as of 11:13, 4 October 2011
Cognitive Performance in WS Subjects (n = 67) versus normal controls
a: Means (circles) and SD (bars) of WAIS-R subtest scores for WS cases. Performance subtests are listed in bold; verbal subtests in plain font. In normal controls (NC), WAIS-R subtest scores are 10±3 (thick gray line). b: Means (circles) and SD (bars) of VIQ, PIQ, and FSIQ scores for WS cases. In normal controls (NC), WAIS-R VIQ, PIQ, and FSIQ scores are 100±15 (thick gray line). c: Principal component analysis of WAIS-R shows subtests contribute differently to intelligence in WS cases versus normal controls. WAIS-R subtest loadings on PC1 in WS cases (x-axis) and normal controls (y-axis). Data used for normal analysis is from Enns and Reddon [27]. Performance subtests are listed in bold; verbal subtests in plain font. The iagonal line is x = y, at which WS and normal loadings are equal.
http://www.plosone.org/article/info%3Adoi%2F10.1371%2Fjournal.pone.0010292
Copyright: © 2010 Gao et al. This is an open-access article distributed under the terms of the Creative Commons Attribution License, which permits unrestricted use, distribution, and reproduction in any medium, provided the original author and source are credited.
File history
Click on a date/time to view the file as it appeared at that time.
| Date/Time | Thumbnail | Dimensions | User | Comment | |
|---|---|---|---|---|---|
| current | 11:12, 4 October 2011 | 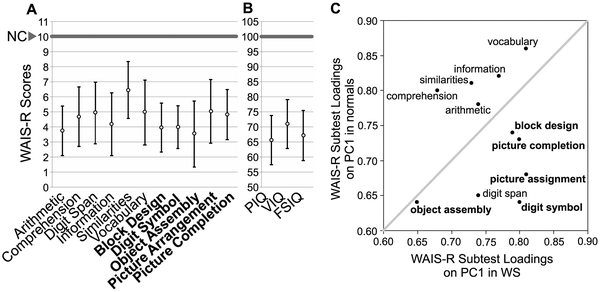 | 600 × 292 (139 KB) | Z3332183 (talk | contribs) | http://www.plosone.org/article/info%3Adoi%2F10.1371%2Fjournal.pone.0010292 Copyright: © 2010 Gao et al. This is an open-access article distributed under the terms of the Creative Commons Attribution License, which permits unrestricted use, distribution, |
You cannot overwrite this file.
File usage
The following 2 pages use this file:
_versus_normal_controls.png&oldid=74620)