File:Effect of Frataxin Levels.jpg
Original file (1,360 × 624 pixels, file size: 84 KB, MIME type: image/jpeg)
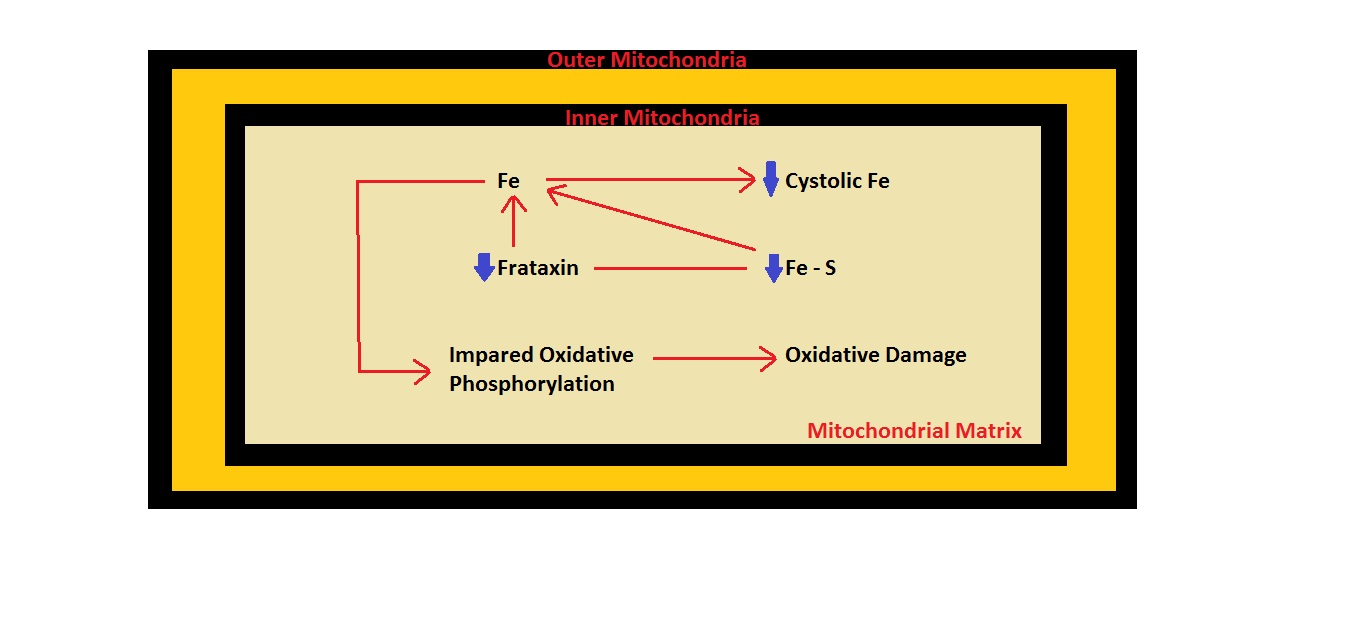
Frataxin Levels in Mitochondria
Image is a diagram of cellular function of decrease levels of frataxin within the Mitochondrial Matrix which causes a cascade of effects leading to the main causes of symptoms described of Friedreich Ataxia.
Inspiration was from:
<pubmed>1896105</pubmed>| PMC1896105
Beginning six months after publication, I (z3332250) grant the public the non-exclusive right to copy, distribute, or display the Work under a Creative Commons Attribution-Noncommercial-Share Alike 3.0 Unported license, as described at http://creativecommons.org/licenses/by-nc-sa/3.0/ and http://creativecommons.org/licenses/by-nc-sa/3.0/legalcode.
Illustrated by student: z3332250
- Note - This image was originally uploaded as part of a student project and may contain inaccuracies in either description or acknowledgements. Students have been advised in writing concerning the reuse of content and may accidentally have misunderstood the original terms of use. If image reuse on this non-commercial educational site infringes your existing copyright, please contact the site editor for immediate removal.
Cite this page: Hill, M.A. (2024, June 16) Embryology Effect of Frataxin Levels.jpg. Retrieved from https://embryology.med.unsw.edu.au/embryology/index.php/File:Effect_of_Frataxin_Levels.jpg
- © Dr Mark Hill 2024, UNSW Embryology ISBN: 978 0 7334 2609 4 - UNSW CRICOS Provider Code No. 00098G
File history
Click on a date/time to view the file as it appeared at that time.
| Date/Time | Thumbnail | Dimensions | User | Comment | |
|---|---|---|---|---|---|
| current | 19:48, 4 October 2011 | | 1,360 × 624 (84 KB) | Z3332250 (talk | contribs) | ==Frataxin Levels in Mitochondria== Image is a diagram of cellular function of decrease levels of frataxin within the Mitochondrial Matrix which causes a cascade of effects leading to the main causes of symptoms described of Friedreich Ataxia. Inspirati |
You cannot overwrite this file.
File usage
The following 3 pages use this file: