USA Statistics: Difference between revisions
mNo edit summary |
mNo edit summary |
||
| Line 8: | Line 8: | ||
{{Statistics Links}} | {{Statistics Links}} | ||
{{USA Links}} | {{USA Links}} | ||
Revision as of 19:08, 10 December 2013
Introduction

This page links to the current online resources available to explore United States (USA) population and birth data.
See also USA Recommended Immunizations for Children.
| Statistics Links: Introduction | Reports | World Population | World Fertility | World Infant Mortality | Maternal Mortality | Australia | Brazil | Canada | China | Germany | India | Indonesia | Europe | Myanmar | Netherlands | Spain | United Kingdom | Romania | Uganda | United States | BGD Tutorial - Applied Embryology and Teratology | National Perinatal Statistics Unit | AIHW | Category:Statistics | |
|
- USA Links: Abnormality Monitoring Programmes | 2006 Abnormality Table | Folic Acid | Assisted Reproductive Technology | Recommended Immunizations | 1990 Embryology in the United States | Embryology Statistics | Category:USA
United States Births


Source - CDC/NCHS, National Vital Statistics System.
Preterm Birth Rate
Preterm birth rates per 100 births in each specified gestational age category.
| Total preterm | Extremely preterm | Early preterm | Late preterm |
| less than 37 weeks’ gestation | less than 28 weeks’ gestation | less than 34 weeks’ gestation | 34–36 weeks’ gestation |
| 12.7 | 0.8 | 3.6 | 9.0 |
- Data: USA Preterm birth rates national Vital Statistics System, United States, 2007.
- Links: Birth | Preterm Birth
Intended and Unintended Births
The following data is from the National Center for Health Statistics report "Intended and unintended births in the United States: 1982-2010".[1] Data used in report primarily from the 2006-2010 National Survey of Family Growth (NSFG), conducted by the Centers for Disease Control and Prevention's National Center for Health Statistics. The 2006-2010 NSFG included in-person interviews with 12,279 women aged 15-44. Some data in the trend analyses are taken from NSFG surveys conducted in 1982, 1988, 1995, and 2002.
- About 37% of births in the United States were unintended at the time of conception.
- The overall proportion unintended has not declined significantly since 1982.
- The proportion unintended did decline significantly between 1982 and 2006-2010 among births to married, non-Hispanic white women.
- Large differences exist between groups in the percentage of births that are unintended. For example, unmarried women, black women, and women with less education or income are still much more likely to experience unintended births compared with married, white, college-educated, and high-income women.

|

|
| Intended births[1] | Unintended births[1] |
Terms
- Intended - Planned; at the right time; wanted then
- Unintended - Unplanned
- Mistimed - Wanted later
- Unwanted - Never wanted
- Links: Pregnancy Risk Assessment Monitoring System | National Campaign to Prevent Teen and Unplanned Pregnancy
Abnormalities
| USA Selected Abnormalities (CDC National estimates for 21 selected major birth defects 2004–2006) | ||
|---|---|---|
| Birth Defects | Cases per Births (1 in ...) | Estimated Annual Number of Cases |
| anencephaly | 4,859 | 859 |
| spina bifida without anencephaly | 2,858 | 1,460 |
| encephalocele | 12,235 | 341 |
| Anophthalmia/microphthalmia | 5,349 | 780 |
| patent ductus arteriosus/common truncus | 13,876 | 301 |
| transposition of the great vessels | 3,333 | 1,252 |
| Tetralogy of Fallot | 2,518 | 1,657 |
| atrial septal defects/ventricular septal defects | 2,122 | 1,966 |
| hypoplastic left heart | 4,344 | 960 |
| cleft palate without cleft lip | 1,574 | 2,651 |
| cleft lip with and without cleft palate | 940 | 4,437 |
| Esophageal atresia/tracheoesophageal fistula | 4,608 | 905 |
| Rectal and large intestinal atresia/stenosis | 2,138 | 1,952 |
| Reduction deformity, upper limbs | 2,869 | 1,454 |
| Reduction deformity, lower limbs | 5,949 | 701 |
| gastroschisis | 2,229 | 1,871 |
| omphalocele | 5,386 | 775 |
| Diaphragmatic hernia | 3,836 | 1,088 |
| Trisomy 13 | 7,906 | 528 |
| Trisomy 21 (Down syndrome) | 691 | 6,037 |
| Trisomy 18 | 3,762 | 1,109 |
General Statistics
Population: 313,232,044 (July 2011 est.) country comparison to the world: 3
Age structure
- 0-14 years: 20.1% (male 32,107,900/female 30,781,823)
- 15-64 years: 66.8% (male 104,411,352/female 104,808,064)
- 65 years and over: 13.1% (male 17,745,363/female 23,377,542) (2011 est.)
Median age
- total: 36.9 years
- male: 35.6 years
- female: 38.2 years (2011 est.)
Population growth rate
- 0.963% (2011 est.)
- country comparison to the world: 119
Birth rate
- 13.83 births/1,000 population (2011 est.)
- country comparison to the world: 149
Death rate
- 8.38 deaths/1,000 population (July 2011 est.)
- country comparison to the world: 89
Sex ratio
- at birth: 1.047 male(s)/female
- under 15 years: 1.04 male(s)/female
- 15-64 years: 1 male(s)/female
- 65 years and over: 0.75 male(s)/female
- total population: 0.97 male(s)/female (2011 est.)
Infant mortality rate
- total: 6.06 deaths/1,000 live births
- country comparison to the world: 176
- male: 6.72 deaths/1,000 live births
- female: 5.37 deaths/1,000 live births (2011 est.)
Life expectancy at birth
- total population: 78.37 years
- country comparison to the world: 50
- male: 75.92 years
- female: 80.93 years (2011 est.)
Total fertility rate
- 2.06 children born/woman (2011 est.)
- country comparison to the world: 123
HIV/AIDS
adult prevalence rate
- 0.6% (2009 est.)
- country comparison to the world: 63
people living with HIV/AIDS
- 1.2 million (2009 est.)
- country comparison to the world: 10
deaths
- 17,000 (2009 est.)
- country comparison to the world: 18
Ethnic groups
- white 79.96% black 12.85%, Asian 4.43%, Amerindian and Alaska native 0.97%, native Hawaiian and other Pacific islander 0.18%, two or more races 1.61% (July 2007 estimate)
note: a separate listing for Hispanic is not included because the US Census Bureau considers Hispanic to mean persons of Spanish/Hispanic/Latino origin including those of Mexican, Cuban, Puerto Rican, Dominican Republic, Spanish, and Central or South American origin living in the US who may be of any race or ethnic group (white, black, Asian, etc.); about 15.1% of the total US population is Hispanic
Data: The World Factbook United States
Assisted Reproductive Technologies

Report cover
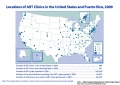
clinics
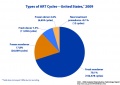
types of ART
outcomes
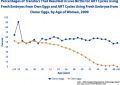
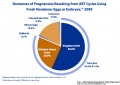
donor-vs-own-eggs
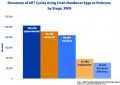
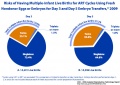
donor fresh outcomes
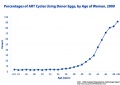
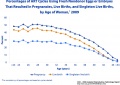
maternal age
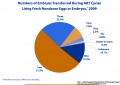
nondonor embryos transferred
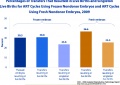
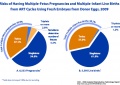
nondonor frozen fresh outcomes
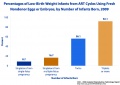
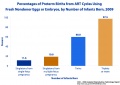
nondonor low birthweight
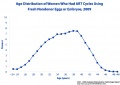
nondonor maternal age
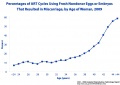
nondonor miscarriage
nondonor outcomes 1
nondonor outcomes 2
nondonor outcomes 3
nondonor outcomes 4
nondonor outcomes 5
nondonor preterm
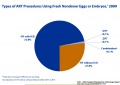
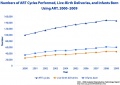
nondonor procedure
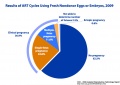
nondonor results


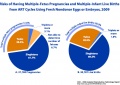
- Graph Links: Report cover | clinics | types of ART | outcomes | donor-vs-own-eggs | donor fresh outcomes | maternal age | nondonor embryos transferred | nondonor frozen fresh outcomes | nondonor low birthweight | nondonor maternal age | nondonor miscarriage | nondonor outcomes 1 | nondonor outcomes 2 | nondonor outcomes 3 | nondonor outcomes 4 | nondonor outcomes 5 | nondonor preterm | nondonor procedure | nondonor results | ART USA | Assisted Reproductive Technology
Congenital Abnormalities
|
Estimated annual number of United States children with long-term sequelae caused by various disease conditions.[2]
|

|
Assumes 4 million live births per year and 20 million children less than 5 years of age. Where applicable, numbers represent means of published estimates. All estimates should be considered useful for rough comparisons only since surveillance methodology, time periods, and diagnostic accuracy varied by study.
- Links: Cytomegalovirus | Torch Infections | Trisomy 21 | Fetal Alcohol Syndrome
Ectopic Pregnancy

Ectopic pregnancy Hospitalizations of women 15 to 44 years of age: United States, 1997–2006[3]

Ectopic Pregnancies - United-States (1970-1992)[4]
Neural Tube Defects


CDC Trends in Spina Bifida and Anencephalus in the United States, 1991-2005[5]
Teen Pregnancy

References
- ↑ 1.0 1.1 1.2 <pubmed>23115878</pubmed>| Intended and Unintended Births in the United States: 1982–2010 PDF
- ↑ Centers for Disease Control and Prevention, Congenital CMV Infection Trends and Statistics http://www.cdc.gov/cmv/trends-stats.html, viewed 6 November 2012 (EST).
- ↑ National Health Statistics Report, 2006 National Hospital Discharge Survey. 2008 July. Report Number 5. Atlanta: Centers for Disease Control and Prevention.
- ↑ <pubmed>7823895</pubmed>| CDC
- ↑ CDC Trends in Spina Bifida and Anencephalus in the United States, 1991-2005 [1]
External Links
External Links Notice - The dynamic nature of the internet may mean that some of these listed links may no longer function. If the link no longer works search the web with the link text or name. Links to any external commercial sites are provided for information purposes only and should never be considered an endorsement. UNSW Embryology is provided as an educational resource with no clinical information or commercial affiliation.
- Centers for Disease Control and Prevention
- Vital Statistics Data Available Online | VitalStats - Perinatal Mortality
- CDC Child Growth Charts United States Clinical Growth Charts
- CDC National Center for Health Statistics Intended and Unintended Births in the United States: 1982–2010 PDF (July 24, 2012)
- CDC Assisted Reproductive Technology
- U.S. Census Bureau U.S. Census Bureau | Publications
- The World Factbook United States
- National Conference of State Legislatures Embryo and Gamete Disposition Laws Updated July 2007
- Pregnancy Risk Assessment Monitoring System PRAMS
- National Campaign to Prevent Teen and Unplanned Pregnancy
- National Center for Health Statistics Use of contraception in the United States: 1982–2008. Vital Health Stat 23(29). 2010. series/sr_23/sr23_029.pdf PDF
Glossary Links
- Glossary: A | B | C | D | E | F | G | H | I | J | K | L | M | N | O | P | Q | R | S | T | U | V | W | X | Y | Z | Numbers | Symbols | Term Link
Cite this page: Hill, M.A. (2024, June 10) Embryology USA Statistics. Retrieved from https://embryology.med.unsw.edu.au/embryology/index.php/USA_Statistics
- © Dr Mark Hill 2024, UNSW Embryology ISBN: 978 0 7334 2609 4 - UNSW CRICOS Provider Code No. 00098G