Template:Main Page News: Difference between revisions
From Embryology
mNo edit summary |
mNo edit summary |
||
| (6 intermediate revisions by the same user not shown) | |||
| Line 3: | Line 3: | ||
| <span style="font-size:150%">'''News - Australia's mothers and babies 2017'''</span> | | <span style="font-size:150%">'''News - Australia's mothers and babies 2017'''</span> | ||
|-bgcolor="F5FAFF" | |-bgcolor="F5FAFF" | ||
| valign=top| [[File:Australia's mothers and babies 2017.jpg|thumb|150px|alt=Australia's mothers and babies 2017|link= | | valign=top| [[File:Australia's mothers and babies 2017.jpg|thumb|150px|alt=Australia's mothers and babies 2017|link=Australia’s mothers and babies 2017]] | ||
[https://www.aihw.gov.au/reports/mothers-babies/australias-mothers-and-babies-2017-in-brief/contents/table-of-contents Australia's mothers and babies 2017—in brief] (27 June 2019) | |||
[https://www.aihw.gov.au/reports/mothers-babies/australias-mothers-and-babies-2017-in-brief/contents/table-of-contents Australia's mothers and babies 2017—in brief] | |||
* In 2017, 301,095 women gave birth in [[Australian Statistics|Australia]], an increase of 4.0% since 2007. | * In 2017, 301,095 women gave birth in [[Australian Statistics|Australia]], an increase of 4.0% since 2007. | ||
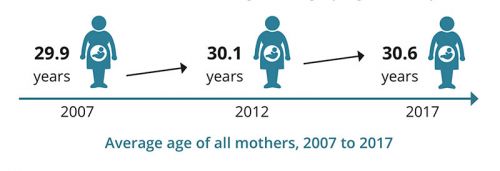
* 30.6 was the average {{maternal age}} of all women who gave birth, compared with 29.9 in 2007. | |||
* 13% of women who gave birth in 2017 had {{gestational diabetes}} | * 13% of women who gave birth in 2017 had {{gestational diabetes}} | ||
* 1 in 3 mothers had a {{caesarean}} section in 2017 | * 1 in 3 mothers had a {{caesarean}} section in 2017 | ||
* 6.7% of liveborn babies were low {{birthweight}} in 2017 | * 6.7% of liveborn babies were low {{birthweight}} in 2017 | ||
[[File:Australian-maternal-age-2007-17.jpg|500px|link=Australia’s mothers and babies 2017]] | |||
{{Ref-AMB2017}} | {{Ref-AMB2017}} | ||