Talk:BGD Tutorial - Applied Embryology and Teratology
2018
- Edited news
- updated Mothers and Babies 2015
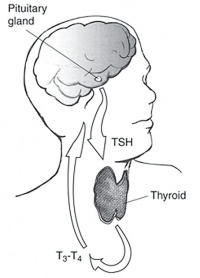
Association of maternal thyroid function during early pregnancy with offspring IQ and brain morphology in childhood[1]
- Maternal levels of free T4 during pregnancy correlate with their offspring's IQ, cortex volume and grey matter volume
- Both the upper and lower limits of normal maternal levels of free T4 during pregnancy are associated with reduced child IQ, as well as decreased child cortex and grey matter volume
• Maternal levels of TSH during pregnancy are not associated with child IQ or child brain morphology
2017
- Edited news
- Updated textbook links
- Updated to mothers and babies 2014
2016
| Mothers 2013 | ||||
|---|---|---|---|---|
Smoking during pregnancy
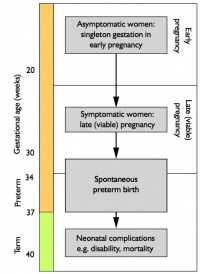
Preterm Birth
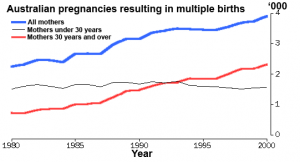
Multiple pregnancy
Presentation at birth2009 data
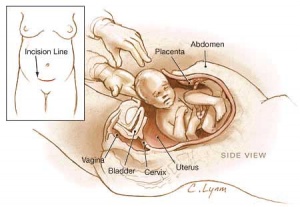
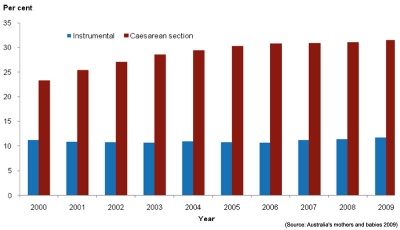
Method of birth2009 data
Pre-existing and pregnancy-related medical conditions
Postnatal length of stay 2009 data
Maternal death 2008–2012 data[2]
|
| Babies |
|---|
|
2009 data
Gestational age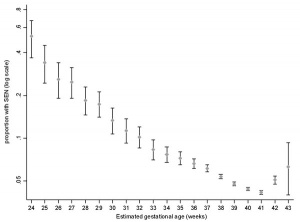 Special educational need by gestational age (UK data)[3] 2009 data
Birthweight2009 data
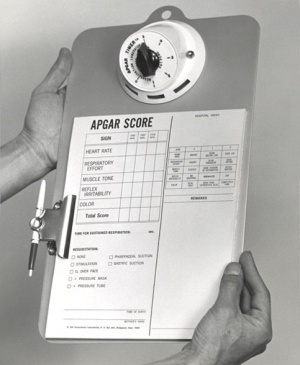
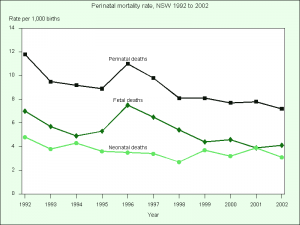
Apgar scores - 1.5% of liveborn babies had a low Apgar score (between 0 and 6) at 5 minutes (More? Apgar test) Special care nurseries (SCN) or neonatal intensive care units (NICU) - 14.2% of liveborn babies admitted (2008 - 14.5%) Perinatal mortality
|
- Long-term glycemic control using polymer-encapsulated human stem cell-derived beta cells in immune-competent mice[4] "The transplantation of glucose-responsive, insulin-producing cells offers the potential for restoring glycemic control in individuals with diabetes. Pancreas transplantation and the infusion of cadaveric islets are currently implemented clinically, but these approaches are limited by the adverse effects of immunosuppressive therapy over the lifetime of the recipient and the limited supply of donor tissue. The latter concern may be addressed by recently described glucose-responsive mature beta cells that are derived from human embryonic stem cells (referred to as SC-β cells), which may represent an unlimited source of human cells for pancreas replacement therapy. ...human SC-β cells were encapsulated with alginate derivatives capable of mitigating foreign-body responses in vivo and implanted into the intraperitoneal space of C57BL/6J mice treated with streptozotocin, which is an animal model for chemically induced type 1 diabetes. These implants induced glycemic correction without any immunosuppression until their removal at 174 d after implantation. Human C-peptide concentrations and in vivo glucose responsiveness demonstrated therapeutically relevant glycemic control. Implants retrieved after 174 d contained viable insulin-producing cells."
eMed Link
Textbook Reading: Moore, K.L. & Persuad, T.V.N. (2008). The Developing Human: Clinically Oriented Embryology (8th ed.). Philadelphia: Saunders. Chapter 20 - Congenital Anatomic Anomalies or Human Birth Defects
Page History
- 2015 - 2015 Print Version PDF (10 pages, 670kb)
- 2015 - Assisted Reproduction Technology section (2014 below)
Assisted Reproduction Technology
Assisted Reproduction Technology (ART) is also sometimes also used to identify In vitro fertilization (IVF) but now includes many new techniques.
Assisted reproductive technology in Australia and New Zealand 2012[5] Nov 2014
2012 ART treatment cycles
- 70,082 assisted reproductive technology (ART) treatment cycles performed in Australia (64,905 ) and New Zealand (5,177),
- 3,590 babies born (including 13,312 liveborn babies) following ART treatment in 2012.
- an increase of 5.8% for Australia and a decrease of 0.2% for New Zealand on 2011.
- 13.7 cycles per 1,000 women of reproductive age (15–44 years) in Australia
- Women used their own oocytes or embryos (autologous) in 95.2% of treatments, and 34.8% of all cycles used frozen/thawed embryos.
- 36,171 women who undertook 66,710 autologous fresh and/or thaw cycles in Australia and New Zealand in 2012.
- average, 1.8 cycles per woman were undertaken in 2012, with more cycles per woman in Australia (1.9 cycles per woman) than in New Zealand (1.5 cycles per woman).
- increase in cycles where preimplantation genetic diagnosis was performed, from 2.0% of cycles in 2011 to 3.7% of cycles in 2012.
- Maternal Age
- women aged under 30, the live delivery rate was 26.0% for both autologous fresh and thaw cycles.
- women aged over 44, the live delivery rate was 0.9% and 4.6% for autologous fresh and thaw cycles respectively.
2011 Data
The following data from previous year
- 66,347 treatment cycles undertaken in Australia and New Zealand.
- 23.1% resulted in a clinical pregnancy and 17.5% in a live delivery (the birth of at least one liveborn baby).
- 12,623 babies (including 12,443 liveborn) born following ART treatment.
- decrease rate of multiple deliveries, 10.0% in 2007 to 6.9% in 2011.
- shifting to single embryo transfer, with the proportion increasing from 63.7% in 2007 to 73.2% in 2011 (rates remained stable at about 23.0% per initiated cycle).
- between 2009 and 2011 cumulative live delivery rate was 21.1% after the first cycle, increasing to 31.1% after two cycles, 36.0% after three cycles, 38.6% after four cycles, and 40.0% after five cycles.
- cumulative live delivery rate did not increase markedly with additional treatments after five cycles.
- 2014 - Update Australia’s mothers and babies 2011.
- 2013 - 2013 Tutorial Version
- 2012 - Update Australia’s mothers and babies 2009 File:BGD Tutorial 2012- Applied Embryology and Teratology Embryology.pdf
Mothers
- 2007 289,496 women gave birth to 294,205 babies
- 2008 292,156 women gave birth to 296,925 babies
- 2007 increase of 4.3% from 2006, and 14.4% increase since 2004
- fetal death component was 2,177 and 2,188 respectively
- 29.9 years was the maternal mean age in 2007
- compared with 28.9 years in 1998 Why is this increasing age important?
- the rate of women aged 15–44 years giving birth in the population decreased slightly between 2007 and 2008.
- 41.6% of mothers had their first baby and 33.5% had their second baby
- 10,883 women were Aboriginal or Torres Strait Islander (3.8% of all women who gave birth)
- 39.5% of all mothers in the Northern Territory
- 25.2 years was the average age of these women who gave birth
- 3.1% women received ART treatment (see also below Assisted Reproduction Technology)
- 2011 - Update Birth defects in Victoria 2005 to 2006
http://www.health.vic.gov.au/ccopmm/vpdc/index.htm
http://www.health.vic.gov.au/ccopmm/downloads/birth_report.pdf
Top birth defects in Victoria - With a few exceptions, the majority of birth defects most commonly found in Victoria are not severe or life threatening to the child.
The incidence of the most common conditions in Victoria in 2005–2006 (in order of prevalence) was found to be:
- Hypospadias – the urethral opening is located on the underside of the penis: one in 135 (male) births
- Obstructive defects of the renal pelvis – abnormalities of the urinary tract: one in 250 births
- Ventricular septal defect – a hole in the tissue that divides the two heart chambers: one in 311 births
- Trisomy 21 – also known as Down’s syndrome, caused by an additional 21st chromosome: one in 339 births
- Congenital dislocation of the hip – the ball of the thigh bone doesn’t fit snugly into the hip bone socket: one in 364 births
- Trisomy 18 – also known as Edward syndrome, includes multiple abnormalities (including those of the heart, diaphragm, lung, kidneys, ureters and palate) caused by an additional 18th chromosome: one in 1,190 births
- Hydrocephalus – a build-up of cerebrospinal fluid inside the skull: one in 1,235 births
- Cleft palate – the roof of the mouth is split down the middle: one in 1,250 births
- Renal agenesis and dysgenesis – one or both kidneys are missing (agenesis) or the kidney is malformed (dysgenesis): one in 1,515 births
- Transposition of the great vessels – the two main arteries leaving the heart are reversed which changes the way blood circulates through the body, leaving a shortage of oxygen in blood flowing from the heart to the rest of the body: one in 1,587 births.
- Neural tube defects
Neural tube defects, such as anencephaly and spina bifida, occur just outside the top 10 most common birth defects, but are widely known. Their prevalence has generally decreased since 1993, most likely due to an increased awareness by the public of their prevention and increased use of folic acid:
- Spina bifida – malformations of the spinal column: one in 1,667 births
- Anencephaly – the brain is partially or completely absent: one in 1,818 births.
- 2010 - Original page on website 2010_BGD_Tutorial_-_Applied_Embryology_and_Teratology. Replaced as now removing dates from pages to avoid multiple copies and confusing navigation. With Wiki, can always view history to see earlier versions.
- 2009 and 2008 - On original website http://embryology.med.unsw.edu.au/Medicine/BGD2tutorial.htm linked to other content pages.
ART 2007
Single Embryo Transfers (SET)
- Significant increase in the number of SET embryos transfer cycles (2002 28.4%, 2005 48.3%)
- increase of SET cycles resulted more singleton deliveries (singleton deliveries 2005 was 85.9%)
- single-embryo transfer babies had better outcomes compared to babies born to women who had a double-embryo transfer (DET).
- 2005 3,681 SET babies and 5,589 DET babies.
- Singletons babies - 96.1% SET, 61.6% DET
- Preterm babies - 11.7% SET, 30.6% DET
- Low birthweight liveborn babies - 8.0% SET, 25.0% DET
ART Perinatal mortality rate
- perinatal mortality rate was 14.7 deaths per 1,000 births (2005)
- 23.8% decrease from 19.3 deaths per 1,000 births in 2004
- Perinatal mortality rate was the lowest among singletons born following SET (7.3 deaths per 1,000 births) in 2005.
(Reference: AIHW National Perinatal Statistics Unit Assisted Reproduction Technology in Australia and New Zealand 2005)
Tutorial Handout
- Current handout print version of Wiki page.
- Previous handouts included teratogenesis extract from "Embryology made Easy" M.W Rana http://www.amazon.com/Human-Embryology-Made-Easy-Waheed/dp/9057025450
- Spiral-bound: 376 pages
- Publisher: CRC Press (July 28, 1998)
- Language: English
- ISBN-10: 9057025450
- ISBN-13: 978-9057025457
eMed
Activity URL Link
http://emed.med.unsw.edu.au/Map.nsf/0/A68811EF91CD53B0CA257339000629DC?OpenDocument&login
- ↑ Korevaar TI, Muetzel R, Medici M, Chaker L, Jaddoe VW, de Rijke YB, Steegers EA, Visser TJ, White T, Tiemeier H & Peeters RP. (2016). Association of maternal thyroid function during early pregnancy with offspring IQ and brain morphology in childhood: a population-based prospective cohort study. Lancet Diabetes Endocrinol , 4, 35-43. PMID: 26497402 DOI.
- ↑ AIHW: Humphrey MD, Bonello MR, Chughtai A, Macaldowie A, Harris K & Chambers GM 2015. Maternal deaths in Australia 2008–2012. Maternal deaths series no. 5. Cat. no. PER 70. Canberra: AIHW.
- ↑ <pubmed>20543995</pubmed>| PLoS Medicine
- ↑ <pubmed>26808346</pubmed>
- ↑ Macaldowie A, Wang YA, Chughtai AA & Chambers GM 2014. Assisted reproductive technology in Australia and New Zealand 2012. Sydney: National Perinatal Epidemiology and Statistics Unit, the University of New South Wales. PDF
