Indonesia Statistics: Difference between revisions
mNo edit summary |
mNo edit summary |
||
| (10 intermediate revisions by the same user not shown) | |||
| Line 4: | Line 4: | ||
This page links to the current online resources available to explore Indonesian population and birth data. | This page links to the current online resources available to explore Indonesian population and birth data. | ||
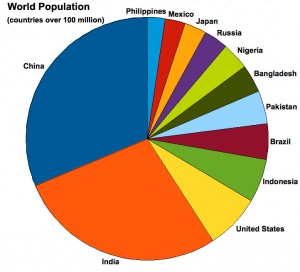
Indonesia is the fourth most populace country in the world, by 2032 it is projected to have more than 300 million people. | |||
{{Statistics Links}} | [[:Category:Indonesia|Category:Indonesia]] | |||
==Some Recent Findings== | |||
[[File:India_sex_ratio_graph.jpg|thumb|300px|alt=India sex ratio graph 1951-2011|India sex ratio (1951-2011)]] | |||
{| | |||
|-bgcolor="F5FAFF" | |||
| | |||
* <ref><pubmed>26405399</pubmed></ref> | |||
|} | |||
{| class="wikitable mw-collapsible mw-collapsed" | |||
! More recent papers | |||
|- | |||
| [[File:Mark_Hill.jpg|90px|left]] {{Most_Recent_Refs}} | |||
Search term: [http://www.ncbi.nlm.nih.gov/pubmed/?term=Indonesia+Embryology ''Indonesia Embryology''] | |||
<pubmed limit=5>Indonesia Embryology</pubmed> | |||
|} | |||
| Line 24: | Line 46: | ||
* 18.1 births/1,000 population (2011 est.) | * 18.1 births/1,000 population (2011 est.) | ||
* country comparison to the world: 105 | * country comparison to the world: 105 | ||
* low birthweight 9 % (2008-2012) | |||
===Death rate=== | ===Death rate=== | ||
* 6.26 deaths/1,000 population (July 2011 est.) | * 6.26 deaths/1,000 population (July 2011 est.) | ||
| Line 34: | Line 58: | ||
* 65 years and over: 0.79 male(s)/female | * 65 years and over: 0.79 male(s)/female | ||
* total population: 1 male(s)/female (2011 est.) | * total population: 1 male(s)/female (2011 est.) | ||
===Infant mortality rate=== | ===Infant mortality rate=== | ||
* total: 27.95 deaths/1,000 live births | * total: 27.95 deaths/1,000 live births | ||
| Line 39: | Line 64: | ||
* male: 32.63 deaths/1,000 live births | * male: 32.63 deaths/1,000 live births | ||
* female: 23.03 deaths/1,000 live births (2011 est.) | * female: 23.03 deaths/1,000 live births (2011 est.) | ||
{| width=600px| | |||
! colspan=3|Infant Mortality Rate | |||
|- | |||
| 1971 | |||
| 1980 | |||
| 1990 | |||
| 1994 | |||
| 1997 | |||
| 2000 | |||
| 2002 | |||
| 2007 | |||
| 2010 | |||
| 2012 | |||
|- | |||
| 145 | |||
| 109 | |||
| 71 | |||
| 66 | |||
| 52 | |||
| 47 | |||
| 43 | |||
| 39 | |||
| 26 | |||
| 34 | |||
|} | |||
===Life expectancy at birth=== | ===Life expectancy at birth=== | ||
* total population: 71.33 years | * total population: 71.33 years | ||
| Line 58: | Line 110: | ||
==Nutrition== | ==Nutrition== | ||
{| | {| | ||
|-bgcolor="F5FAFF" | |||
| Low birthweight (%) 2008-2012* | | Low birthweight (%) 2008-2012* | ||
| 9 | | 9 | ||
| Line 63: | Line 116: | ||
| Early initiation of breastfeeding (%), 2008-2012* | | Early initiation of breastfeeding (%), 2008-2012* | ||
| 29.3 | | 29.3 | ||
|- | |-bgcolor="F5FAFF" | ||
| Exclusive breastfeeding <6 months (%), 2008-2012* | | Exclusive breastfeeding <6 months (%), 2008-2012* | ||
| 41.5 | | 41.5 | ||
| Line 69: | Line 122: | ||
| Introduction of solid, semi-solid or soft foods 6-8 months (%), 2008-2012* | | Introduction of solid, semi-solid or soft foods 6-8 months (%), 2008-2012* | ||
| 84.6 | | 84.6 | ||
|- | |-bgcolor="F5FAFF" | ||
| Breastfeeding at age 2 (%), 2008-2012* | | Breastfeeding at age 2 (%), 2008-2012* | ||
| 55.3 | | 55.3 | ||
| Line 75: | Line 128: | ||
| Underweight (%) 2008-2012*, moderate & severe | | Underweight (%) 2008-2012*, moderate & severe | ||
| 17.9 | | 17.9 | ||
|- | |-bgcolor="F5FAFF" | ||
| Underweight (%) 2008-2012*, severe | | Underweight (%) 2008-2012*, severe | ||
| 4.9 | | 4.9 | ||
| Line 81: | Line 134: | ||
| Stunting (%) 2008-2012*, moderate & severe | | Stunting (%) 2008-2012*, moderate & severe | ||
| 35.6 | | 35.6 | ||
|- | |-bgcolor="F5FAFF" | ||
| Wasting (%) 2008-2012*, moderate & severe | | Wasting (%) 2008-2012*, moderate & severe | ||
| 13.3 | | 13.3 | ||
| Line 87: | Line 140: | ||
| Overweight (%) 2008-2012*, moderate & severe | | Overweight (%) 2008-2012*, moderate & severe | ||
| 12.3 | | 12.3 | ||
|- | |-bgcolor="F5FAFF" | ||
| Vitamin A supplementation full coverage (%) 2012 | | Vitamin A supplementation full coverage (%) 2012 | ||
| 73 | | 73 | ||
| Line 95: | Line 148: | ||
|} | |} | ||
Data: [http://www.unicef.org/infobycountry/indonesia_statistics.html UNICEF Statistics] Low birthweight - Demographic and Health Surveys (DHS), Multiple Indicator Cluster Surveys (MICS), other national householdsurveys and data from routine reporting systems; Breastfeeding - DHS, MICS, and UNICEF; Underweight, wasting and stunting - DHS, MICS, World Health Organization (WHO) and UNICEF; Salt iodization - MICS, DHS and UNICEF; Vitamin A - UNICEF field offices and WHO. | Data 2013: [http://www.unicef.org/infobycountry/indonesia_statistics.html UNICEF Statistics] Low birthweight - Demographic and Health Surveys (DHS), Multiple Indicator Cluster Surveys (MICS), other national householdsurveys and data from routine reporting systems; Breastfeeding - DHS, MICS, and UNICEF; Underweight, wasting and stunting - DHS, MICS, World Health Organization (WHO) and UNICEF; Salt iodization - MICS, DHS and UNICEF; Vitamin A - UNICEF field offices and WHO. | ||
==External Links== | ==External Links== | ||
{{External Links}} | {{External Links}} | ||
* '''Statistics Indonesia''' [http://www.bps.go.id | * '''Statistics Indonesia''' [http://www.bps.go.id/index.php homepage] | ||
** [http://www.bps.go.id/eng/tab_sub/view.php?kat=1&tabel=1&daftar=1&id_subyek=12¬ab=7 Total Fertility Rate (TFR) by Province] | ** [http://www.bps.go.id/eng/tab_sub/view.php?kat=1&tabel=1&daftar=1&id_subyek=12¬ab=7 Total Fertility Rate (TFR) by Province] | ||
** [http://www.bps.go.id/eng/tab_sub/view.php?kat=1&tabel=1&daftar=1&id_subyek=12¬ab=5 Infant Mortality Rate (IMR) by Province] | ** [http://www.bps.go.id/eng/tab_sub/view.php?kat=1&tabel=1&daftar=1&id_subyek=12¬ab=5 Infant Mortality Rate (IMR) by Province] | ||
| Line 107: | Line 163: | ||
{{Glossary}} | {{Glossary}} | ||
| Line 113: | Line 169: | ||
{{Footer}} | {{Footer}} | ||
[[Category:Statistics]] [[Category:Birth]] [[Category:Indonesia]] | |||
Latest revision as of 18:48, 28 September 2015
| Embryology - 25 Apr 2024 |
|---|
| Google Translate - select your language from the list shown below (this will open a new external page) |
|
العربية | català | 中文 | 中國傳統的 | français | Deutsche | עִברִית | हिंदी | bahasa Indonesia | italiano | 日本語 | 한국어 | မြန်မာ | Pilipino | Polskie | português | ਪੰਜਾਬੀ ਦੇ | Română | русский | Español | Swahili | Svensk | ไทย | Türkçe | اردو | ייִדיש | Tiếng Việt These external translations are automated and may not be accurate. (More? About Translations) |
Introduction

This page links to the current online resources available to explore Indonesian population and birth data.
Indonesia is the fourth most populace country in the world, by 2032 it is projected to have more than 300 million people.
| Statistics Links: Introduction | Reports | World Population | World Fertility | World Infant Mortality | Maternal Mortality | Australia | Brazil | Canada | China | Germany | India | Indonesia | Europe | Myanmar | Netherlands | Spain | United Kingdom | Romania | Uganda | United States | BGD Tutorial - Applied Embryology and Teratology | National Perinatal Statistics Unit | AIHW | Category:Statistics | |
|
Some Recent Findings

| More recent papers |
|---|
 This table allows an automated computer search of the external PubMed database using the listed "Search term" text link.
More? References | Discussion Page | Journal Searches | 2019 References | 2020 References Search term: Indonesia Embryology <pubmed limit=5>Indonesia Embryology</pubmed> |
General Statistics
Population 245,613,043 (July 2011 est.) country comparison to the world: 4
Age structure
- 0-14 years: 27.3% (male 34,165,213/female 32,978,841)
- 15-64 years: 66.5% (male 82,104,636/female 81,263,055)
- 65 years and over: 6.1% (male 6,654,695/female 8,446,603) (2011 est.)
Median age
- total: 28.2 years
- male: 27.7 years
- female: 28.7 years (2011 est.)
Population growth rate
- 1.069% (2011 est.)
- country comparison to the world: 111
Birth rate
- 18.1 births/1,000 population (2011 est.)
- country comparison to the world: 105
- low birthweight 9 % (2008-2012)
Death rate
- 6.26 deaths/1,000 population (July 2011 est.)
- country comparison to the world: 156
Sex ratio
- at birth: 1.05 male(s)/female
- under 15 years: 1.04 male(s)/female
- 15-64 years: 1.01 male(s)/female
- 65 years and over: 0.79 male(s)/female
- total population: 1 male(s)/female (2011 est.)
Infant mortality rate
- total: 27.95 deaths/1,000 live births
- country comparison to the world: 72
- male: 32.63 deaths/1,000 live births
- female: 23.03 deaths/1,000 live births (2011 est.)
| Infant Mortality Rate | |||||||||
|---|---|---|---|---|---|---|---|---|---|
| 1971 | 1980 | 1990 | 1994 | 1997 | 2000 | 2002 | 2007 | 2010 | 2012 |
| 145 | 109 | 71 | 66 | 52 | 47 | 43 | 39 | 26 | 34 |
Life expectancy at birth
- total population: 71.33 years
- country comparison to the world: 137
- male: 68.8 years
- female: 73.99 years (2011 est.)
Total fertility rate
2.25 children born/woman (2011 est.) country comparison to the world: 103
Major infectious diseases
- degree of risk: high
- food or waterborne diseases: bacterial diarrhea, hepatitis A and E, and typhoid fever
- vectorborne diseases: chikungunya, dengue fever, and malaria
Data: The World Factbook Indonesia
Nutrition
| Low birthweight (%) 2008-2012* | 9 |
| Early initiation of breastfeeding (%), 2008-2012* | 29.3 |
| Exclusive breastfeeding <6 months (%), 2008-2012* | 41.5 |
| Introduction of solid, semi-solid or soft foods 6-8 months (%), 2008-2012* | 84.6 |
| Breastfeeding at age 2 (%), 2008-2012* | 55.3 |
| Underweight (%) 2008-2012*, moderate & severe | 17.9 |
| Underweight (%) 2008-2012*, severe | 4.9 |
| Stunting (%) 2008-2012*, moderate & severe | 35.6 |
| Wasting (%) 2008-2012*, moderate & severe | 13.3 |
| Overweight (%) 2008-2012*, moderate & severe | 12.3 |
| Vitamin A supplementation full coverage (%) 2012 | 73 |
| Iodized salt consumption (%) 2008-2012* | 62.3 |
Data 2013: UNICEF Statistics Low birthweight - Demographic and Health Surveys (DHS), Multiple Indicator Cluster Surveys (MICS), other national householdsurveys and data from routine reporting systems; Breastfeeding - DHS, MICS, and UNICEF; Underweight, wasting and stunting - DHS, MICS, World Health Organization (WHO) and UNICEF; Salt iodization - MICS, DHS and UNICEF; Vitamin A - UNICEF field offices and WHO.
External Links
External Links Notice - The dynamic nature of the internet may mean that some of these listed links may no longer function. If the link no longer works search the web with the link text or name. Links to any external commercial sites are provided for information purposes only and should never be considered an endorsement. UNSW Embryology is provided as an educational resource with no clinical information or commercial affiliation.
Glossary Links
- Glossary: A | B | C | D | E | F | G | H | I | J | K | L | M | N | O | P | Q | R | S | T | U | V | W | X | Y | Z | Numbers | Symbols | Term Link
Cite this page: Hill, M.A. (2024, April 25) Embryology Indonesia Statistics. Retrieved from https://embryology.med.unsw.edu.au/embryology/index.php/Indonesia_Statistics
- © Dr Mark Hill 2024, UNSW Embryology ISBN: 978 0 7334 2609 4 - UNSW CRICOS Provider Code No. 00098G
- ↑ <pubmed>26405399</pubmed>