File:USA cesarean rate by gestational age.jpg
USA_cesarean_rate_by_gestational_age.jpg (498 × 481 pixels, file size: 39 KB, MIME type: image/jpeg)
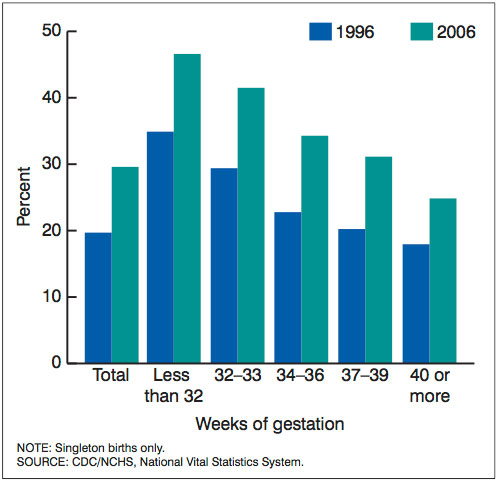
Cesarean delivery rates by gestational age, United States: 1996 and 2006
The cesarean delivery rate rose 3 percent to 31.1 percent of all births, another record high. The cesarean rate has climbed 50 per cent since the 1996 low. Rates for primary cesareans were up and vaginal births after previous cesarean were down for both revised and unrevised reporting areas. Cesarean rates have risen at all gestational ages over the last decade.
The overall cesarean delivery rate or total cesarean rate is computed as the percentage of all births delivered by cesarean. The primary cesarean rate relates the number of women having a first cesarean delivery to all women giving birth who have never had a cesarean delivery. The denominator for this rate includes the sum of primary cesareans and vaginal births without previous cesarean. The rate of vaginal birth after previous cesarean (VBAC) delivery is computed by relating all VBAC deliveries to the sum of VBAC and repeat cesarean deliveries, that is, to women with a previous cesarean delivery.
Information on ‘‘Method of Delivery’’ is reported on both the 2003 Standard Certificate of Live Birth (revised) and 1989 Standard Cer tificate of Live Birth (unrevised). However, the format and wording of the ‘‘Method of Delivery’’ item on the revised standard certificate differs from that of the unrevised standard certificate. The unrevised item asks a direct question on whether the birth was vaginal, VBAC, or a primary or repeat cesarean delivery. In contrast, the revised ‘‘Method of Delivery’’ item asks if the final route of delivery was a vaginal (with or without forceps or vacuum assistance) or a cesarean delivery. Infor mation on the type of vaginal (vaginal or VBAC) or type of cesarean delivery (primary or repeat) is calculated from the response to a question under a different item, ‘‘Risk Factors in this Pregnancy,’’ which asks if the mother had a previous cesarean delivery. As a result of these changes, although data on total cesarean deliveries appear to be very comparable between revisions, information on type of vaginal or cesarean delivery is not. In brief, rates based on data from the revised certificates are substantially higher for VBACs and primary cesareans, and lower for repeat cesareans, than rates based on data from unre vised certificates (55). Accordingly, data on VBAC, primary, and repeat cesarean deliveries are not directly comparable between revisions, and, beginning with the 2005 data year, are presented separately for revised and unrevised reporting areas.
SOURCE: CDC/NCHS, National Vital Statistics System.
NOTE: Singleton births only.
Martin JA, Hamilton BE, Sutton PD, Ventura SJ, et al. Births: Final data for 2006. National vital statistics reports; vol 57 no 7. Hyattsville, MD: National Center for Health Statistics. 2009.
Copyright information - All material appearing in this report is in the public domain and may be reproduced or copied without permission; citation as to source, however, is appreciated
File history
Click on a date/time to view the file as it appeared at that time.
| Date/Time | Thumbnail | Dimensions | User | Comment | |
|---|---|---|---|---|---|
| current | 17:37, 9 April 2010 | | 498 × 481 (39 KB) | S8600021 (talk | contribs) | Cesarean delivery rates by gestational age, United States: 1996 and 2006 SOURCE: CDC/NCHS, National Vital Statistics System. NOTE: Singleton births only. Martin JA, Hamilton BE, Sutton PD, Ventura SJ, et al. Births: Final data for 2006. National vital |
You cannot overwrite this file.
File usage
The following 2 pages use this file: