File:Trisomy 21 - nuchal translucency graph 02.jpg
Trisomy_21_-_nuchal_translucency_graph_02.jpg (500 × 498 pixels, file size: 30 KB, MIME type: image/jpeg)
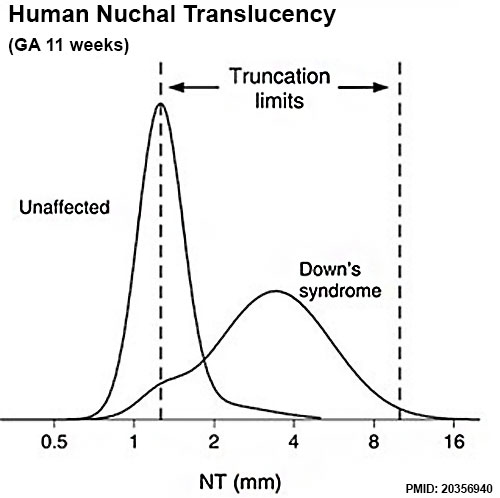
Trisomy 21 - Nuchal Translucency Graph
- Mixture model distributions of nuchal translucency (NT) in mm and distributions of NT multiple of the median (MoM) values in Down's syndrome and unaffected pregnancies at 11, 12 and 13 completed weeks' gestation.
- Truncation limits shown (vertical lines) are those specified by Wright et al. PMID 18383462.
- Links: GA week 11 graph | GA week 11-13 graph | Trisomy 21
Reference
<pubmed>20356940</pubmed>| J Med Screen.
Copyright
This is an open-access article distributed under the terms of the Creative Commons Attribution License, which permits unrestricted use, distribution, and reproduction in any medium, provided the original work is properly cited. Figure 1 F1.large.jpg Panel ! from figure.
Cite this page: Hill, M.A. (2024, April 19) Embryology Trisomy 21 - nuchal translucency graph 02.jpg. Retrieved from https://embryology.med.unsw.edu.au/embryology/index.php/File:Trisomy_21_-_nuchal_translucency_graph_02.jpg
- © Dr Mark Hill 2024, UNSW Embryology ISBN: 978 0 7334 2609 4 - UNSW CRICOS Provider Code No. 00098G
File history
Click on a date/time to view the file as it appeared at that time.
| Date/Time | Thumbnail | Dimensions | User | Comment | |
|---|---|---|---|---|---|
| current | 22:27, 3 August 2016 | | 500 × 498 (30 KB) | Z8600021 (talk | contribs) | ==Trisomy 21 - Nuchal Translucency Graph== * Mixture model distributions of nuchal translucency (NT) in mm and distributions of NT multiple of the median (MoM) values in Down's syndrome and unaffected pregnancies at 11, 12 and 13 completed weeks' gest... |
You cannot overwrite this file.
File usage
The following 2 pages use this file: