File:Spleen structure 01.jpg: Difference between revisions
From Embryology
| Line 1: | Line 1: | ||
==Spleen Structure== | ==Spleen Structure and Cell Distribution== | ||
{| | {| | ||
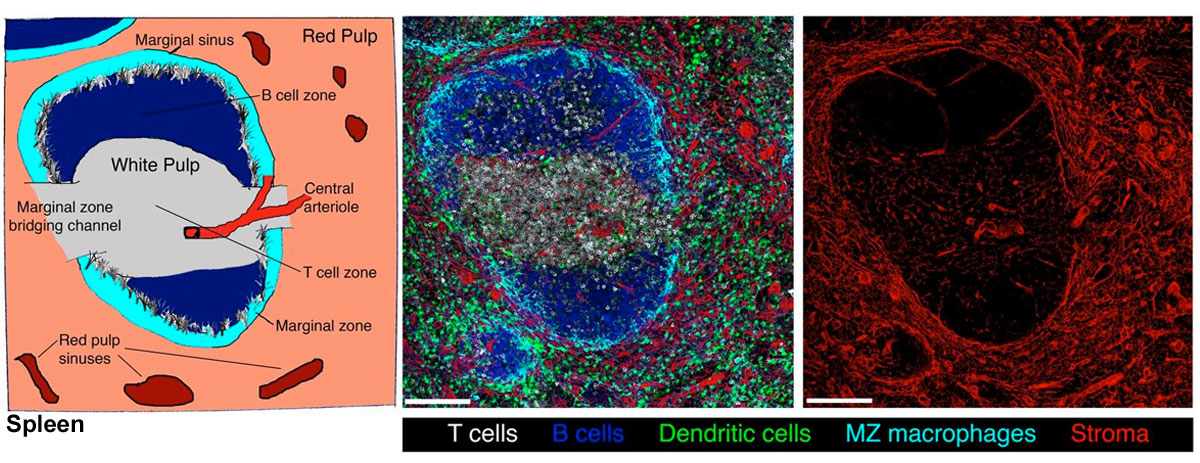
| Schematic representation of the organization of the spleen (left panel). | | valign="top"|Schematic representation of the organization of the spleen (left panel). | ||
* The white pulp consists of T cell (lymphocyte) zones (also known as the periarteriolar lymphoid sheath (PALS)) containing networks of fibroblastic reticular cells (FRC) surrounding a central arteriole, together with B cell follicles containing a central network of follicular dendritic cells (FDC). | * The white pulp consists of T cell (lymphocyte) zones (also known as the periarteriolar lymphoid sheath (PALS)) containing networks of fibroblastic reticular cells (FRC) surrounding a central arteriole, together with B cell follicles containing a central network of follicular dendritic cells (FDC). | ||
| Line 9: | Line 9: | ||
* Large numbers of macrophages phagocytose dying or damaged red blood cells in the red pulp (not shown). | * Large numbers of macrophages phagocytose dying or damaged red blood cells in the red pulp (not shown). | ||
* Immune cells enter the white pulp at regions where the T cell zones abut the MZ, known as the MZ bridging channels. | * Immune cells enter the white pulp at regions where the T cell zones abut the MZ, known as the MZ bridging channels. | ||
| An image of a section of mouse spleen generated using multicolour immunofluoresence microscopy illustrates the organization of the white pulp, red pulp, and MZ (centre panel). | | valign="top"|An image of a section of mouse spleen generated using multicolour immunofluoresence microscopy illustrates the organization of the white pulp, red pulp, and MZ (centre panel). | ||
* The distribution of cells: | * The distribution of cells: | ||
** '''T cells''' - (white) CD3+ | ** '''T cells''' - (white) CD3+ | ||
Revision as of 12:58, 26 February 2012
Spleen Structure and Cell Distribution
Schematic representation of the organization of the spleen (left panel).
|
An image of a section of mouse spleen generated using multicolour immunofluoresence microscopy illustrates the organization of the white pulp, red pulp, and MZ (centre panel).
Scale bars represent 130 μM. |
Reference
<pubmed>19644499</pubmed>| PMC2785037 | Nat Rev Immunol.
File history
Click on a date/time to view the file as it appeared at that time.
| Date/Time | Thumbnail | Dimensions | User | Comment | |
|---|---|---|---|---|---|
| current | 18:55, 22 February 2012 | 1,200 × 463 (211 KB) | Z8600021 (talk | contribs) |
You cannot overwrite this file.
File usage
The following page uses this file: