File:Schematic diagram detailing genes deleted in probands.jpeg

Original file (2,850 × 2,075 pixels, file size: 480 KB, MIME type: image/jpeg)
Original file name: pone.0012349.s007.tif
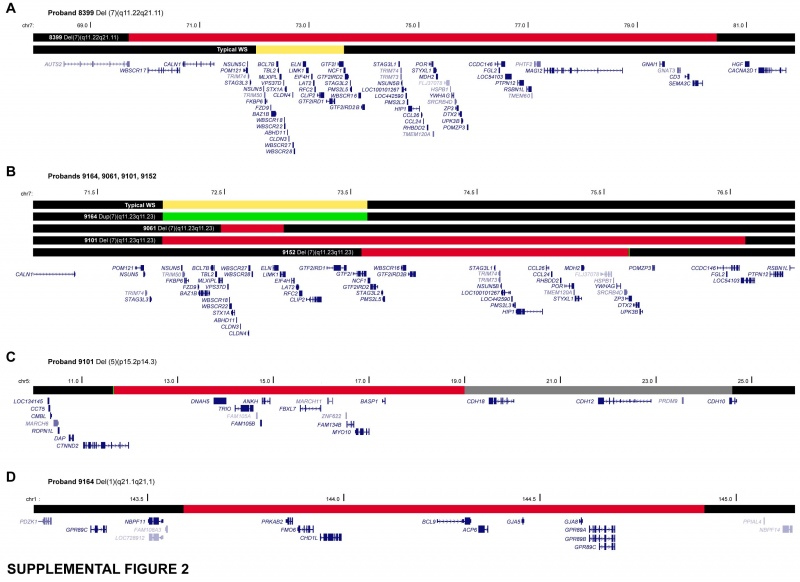
Schematic diagrams detailing genes deleted in probands. The red box on each diagram represents the affected region. The LCR-mediated, typical WS deleted region is shown in yellow on A and B. The RefSeq and sno/miRNA genes deleted for each proband are shown. Diagrams were adapted from UCSC Genome Browser [26]. (A,B) Genes affected on chromosome 7 including all or part of the WS typical region for probands (A) 8399, (B) 9164, 9061, 9101 and 9152. (C) Genes impacted by the deletion (red) and inversion (grey) on chromosome 5 of proband 9101. Note the disruption of CDH10 at the inversion junction. (D) Deletion on chromosome 1 of proband 9164 impacting 10 RefSeq genes.
Reference
Ariel M. Pani et al ‘’’ Genome Rearrangements Detected by SNP Microarrays in Individuals with Intellectual Disability Referred with Possible Williams Syndrome.’’’ PLoS ONE: 2010, 5(8);e12349 PMID: 20824207
http://www.ncbi.nlm.nih.gov/pmc/articles/PMC2930846/#pone.0012349.s007
Copyright Pani et al. This is an open-access article distributed under the terms of the Creative Commons Attribution License, which permits unrestricted use, distribution, and reproduction in any medium, provided the original author and source are credited.
- Note - This image was originally uploaded as part of a student project and may contain inaccuracies in either description or acknowledgements. Students have been advised in writing concerning the reuse of content and may accidentally have misunderstood the original terms of use. If image reuse on this non-commercial educational site infringes your existing copyright, please contact the site editor for immediate removal.
Cite this page: Hill, M.A. (2024, April 25) Embryology Schematic diagram detailing genes deleted in probands.jpeg. Retrieved from https://embryology.med.unsw.edu.au/embryology/index.php/File:Schematic_diagram_detailing_genes_deleted_in_probands.jpeg
- © Dr Mark Hill 2024, UNSW Embryology ISBN: 978 0 7334 2609 4 - UNSW CRICOS Provider Code No. 00098G
File history
Click on a date/time to view the file as it appeared at that time.
| Date/Time | Thumbnail | Dimensions | User | Comment | |
|---|---|---|---|---|---|
| current | 20:41, 4 October 2011 | | 2,850 × 2,075 (480 KB) | Z3332183 (talk | contribs) | Original file name: pone.0012349.s007.tif Schematic diagrams detailing genes deleted in probands. The red box on each diagram represents the affected region. The LCR-mediated, typical WS deleted region is shown in yellow on A and B. The RefSeq and sno/mi |
You cannot overwrite this file.
File usage
The following page uses this file: