File:Ovary oocyte size graph.jpg

Original file (1,057 × 820 pixels, file size: 114 KB, MIME type: image/jpeg)
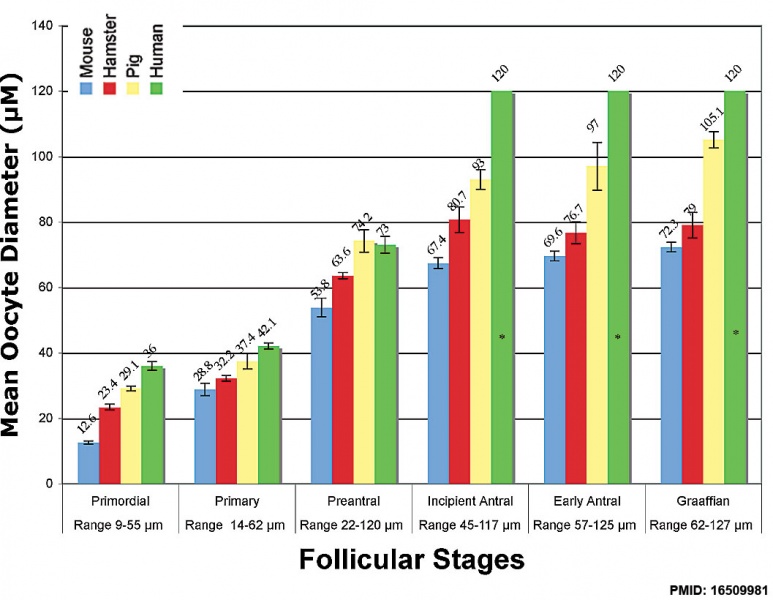
Oocyte Growth in Maturational Stages
Bar graph of oocyte diameter versus follicular stage.
Asterisk indicates values from previously published data for reference (PMID 15763114), and therefore do not include error bars. Values are the mean ± standard error.
- Follicle Links: Follicle size graph | Oocyte size graph | oocyte | ovary | Mouse | pig | Hamster
Reference
Griffin J, Emery BR, Huang I, Peterson CM & Carrell DT. (2006). Comparative analysis of follicle morphology and oocyte diameter in four mammalian species (mouse, hamster, pig, and human). J. Exp. Clin. Assist. Reprod. , 3, 2. PMID: 16509981 DOI.
Copyright
© 2006 Griffin et al; licensee BioMed Central Ltd. This is an Open Access article distributed under the terms of the Creative Commons Attribution License (http://creativecommons.org/licenses/by/2.0), which permits unrestricted use, distribution, and reproduction in any medium, provided the original work is properly cited.
Griffin et al. Journal of Experimental & Clinical Assisted Reproduction 2006 3:2 doi:10.1186/1743-1050-3-2
Figure 3 Original graph altered in size and labelling.
Cite this page: Hill, M.A. (2024, April 20) Embryology Ovary oocyte size graph.jpg. Retrieved from https://embryology.med.unsw.edu.au/embryology/index.php/File:Ovary_oocyte_size_graph.jpg
- © Dr Mark Hill 2024, UNSW Embryology ISBN: 978 0 7334 2609 4 - UNSW CRICOS Provider Code No. 00098G
File history
Click on a date/time to view the file as it appeared at that time.
| Date/Time | Thumbnail | Dimensions | User | Comment | |
|---|---|---|---|---|---|
| current | 09:29, 6 January 2015 | | 1,057 × 820 (114 KB) | Z8600021 (talk | contribs) |
You cannot overwrite this file.
File usage
The following 4 pages use this file: