File:Ovary oocyte size graph.jpg: Difference between revisions
mNo edit summary |
|||
| Line 1: | Line 1: | ||
==Oocyte Growth in Maturational Stages== | ==Oocyte Growth in Maturational Stages== | ||
Bar graph of oocyte diameter versus follicular stage. | Bar graph of oocyte diameter versus follicular stage. This graph shows a comparison of follicle morphology and oocyte diameter in four mammalian species: {{mouse}}, {{hamster}}, {{pig}}, and human. | ||
Asterisk indicates values from previously published data for reference (PMID 15763114), and therefore do not include error bars. Values are the mean ± standard error. | Asterisk indicates values from previously published data for reference (PMID 15763114), and therefore do not include error bars. Values are the mean ± standard error. | ||
:'''Follicle Links:''' [[:File:Ovary follicle size graph.jpg|Follicle size graph]] | [[:File:Ovary oocyte size graph.jpg|Oocyte size graph]] | {{oocyte}} | {{Ovary}} | | :'''Follicle Links:''' [[:File:Ovary follicle size graph.jpg|Follicle size graph]] | [[:File:Ovary oocyte size graph.jpg|Oocyte size graph]] | {{oocyte}} | {{Ovary}} | {{Mouse}} | {{Pig}} | [[Hamster Development|Hamster]] | ||
===Reference=== | ===Reference=== | ||
Revision as of 10:07, 6 April 2020
Oocyte Growth in Maturational Stages
Bar graph of oocyte diameter versus follicular stage. This graph shows a comparison of follicle morphology and oocyte diameter in four mammalian species: mouse, hamster, pig, and human.
Asterisk indicates values from previously published data for reference (PMID 15763114), and therefore do not include error bars. Values are the mean ± standard error.
- Follicle Links: Follicle size graph | Oocyte size graph | oocyte | ovary | mouse | pig | Hamster
Reference
Griffin J, Emery BR, Huang I, Peterson CM & Carrell DT. (2006). Comparative analysis of follicle morphology and oocyte diameter in four mammalian species (mouse, hamster, pig, and human). J. Exp. Clin. Assist. Reprod. , 3, 2. PMID: 16509981 DOI.
Copyright
© 2006 Griffin et al; licensee BioMed Central Ltd. This is an Open Access article distributed under the terms of the Creative Commons Attribution License (http://creativecommons.org/licenses/by/2.0), which permits unrestricted use, distribution, and reproduction in any medium, provided the original work is properly cited.
Griffin et al. Journal of Experimental & Clinical Assisted Reproduction 2006 3:2 doi:10.1186/1743-1050-3-2
Figure 3 Original graph altered in size and labelling.
Cite this page: Hill, M.A. (2024, April 18) Embryology Ovary oocyte size graph.jpg. Retrieved from https://embryology.med.unsw.edu.au/embryology/index.php/File:Ovary_oocyte_size_graph.jpg
- © Dr Mark Hill 2024, UNSW Embryology ISBN: 978 0 7334 2609 4 - UNSW CRICOS Provider Code No. 00098G
File history
Click on a date/time to view the file as it appeared at that time.
| Date/Time | Thumbnail | Dimensions | User | Comment | |
|---|---|---|---|---|---|
| current | 09:29, 6 January 2015 | 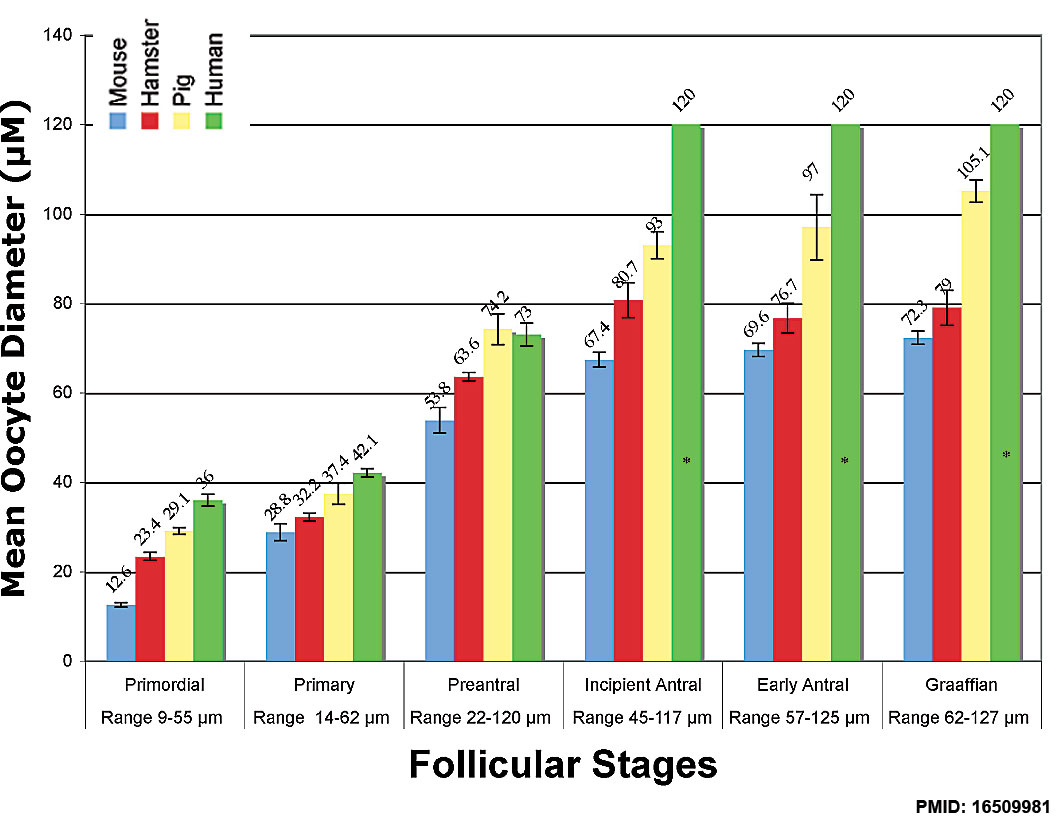 | 1,057 × 820 (114 KB) | Z8600021 (talk | contribs) |
You cannot overwrite this file.
File usage
The following 4 pages use this file: