File:Graph.jpg: Difference between revisions
| Line 1: | Line 1: | ||
=BMI for different PCOS Phenotypes= | =BMI for different PCOS Phenotypes= | ||
A graph comparing the BMI for sisters exhibiting different PCOS phenotypes. Constructed by student z3459224. | A graph comparing the BMI for PCOS probands and their sisters exhibiting different PCOS phenotypes. PCOS probands and PCOS sisters had elevated BMI levels compared to hyperandrogenic sisters and those sisters who were unaffected. These results indicate that the BMI decreased as the phenotype improved and hence BMI or adiposity may play an important role in PCOS development. Constructed by student z3459224. | ||
Based upon results from the article below. | Based upon results from the article below. | ||
Latest revision as of 21:51, 23 October 2015
BMI for different PCOS Phenotypes
A graph comparing the BMI for PCOS probands and their sisters exhibiting different PCOS phenotypes. PCOS probands and PCOS sisters had elevated BMI levels compared to hyperandrogenic sisters and those sisters who were unaffected. These results indicate that the BMI decreased as the phenotype improved and hence BMI or adiposity may play an important role in PCOS development. Constructed by student z3459224.
Based upon results from the article below.
Reference
<pubmed>PMC24557</pubmed>
"Beginning six months after publication, I z3459224 grant the public the non-exclusive right to copy, distribute, or display the Work under a Creative Commons Attribution-Noncommercial-Share Alike 3.0 Unported license, as described at http://creativecommons.org/licenses/by-nc-sa/3.0/ and http://creativecommons.org/licenses/by-nc-sa/3.0/legalcode."
File history
Click on a date/time to view the file as it appeared at that time.
| Date/Time | Thumbnail | Dimensions | User | Comment | |
|---|---|---|---|---|---|
| current | 08:35, 23 October 2015 | 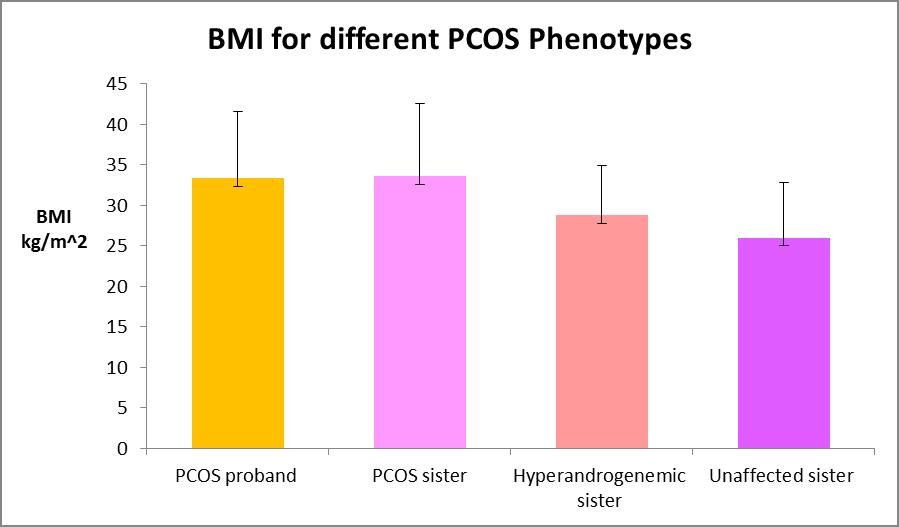 | 899 × 527 (35 KB) | Z3459224 (talk | contribs) |
You cannot overwrite this file.
File usage
The following 2 pages use this file: