File:Gene expression responses of Friedreich's ataxia.jpg: Difference between revisions
('''Gene expression responses of Friedreich's ataxia''' ---- ==Analogous gene expression responses in blood from children and adults with FRDA.== ---- (A) A common gene signature is representative of a genotoxic stress response found by Gene Set Analysis.) |
No edit summary |
||
| Line 9: | Line 9: | ||
---- | ---- | ||
Copyright This is an open-access article distributed under the terms of the Creative Commons Public Domain declaration which stipulates that, once placed in the public domain, this work may be freely reproduced, distributed, transmitted, modified, built upon, or otherwise used by anyone for any lawful purpose. | Copyright This is an open-access article distributed under the terms of the Creative Commons Public Domain declaration which stipulates that, once placed in the public domain, this work may be freely reproduced, distributed, transmitted, modified, built upon, or otherwise used by anyone for any lawful purpose. | ||
'''Reference:''' | |||
<pubmed>20090835</pubmed>| [http://www.ncbi.nlm.nih.gov/pubmed/20090835/] | |||
Revision as of 11:39, 6 October 2011
Gene expression responses of Friedreich's ataxia
Analogous gene expression responses in blood from children and adults with FRDA.
(A) A common gene signature is representative of a genotoxic stress response found by Gene Set Analysis. Twenty-three genotoxic stress response gene sets were searched for common genes. This heat map, generated by unsupervised clustering, displays the genes present in at least 6 of the 23 gene sets and compares transcript levels between FRDA patients, the adult and children cohorts, and controls. Yellow=upregulated; Blue=downregulated. C=Control; P=Patient. Note that while three patients and one control did not segregate with their respective groups, all adult patients and controls clustered in two separate groups in this unsupervised clustering. (B) Heat-map generated by unsupervised clustering of FRDA and control samples, which displays the overlap of significantly differentially expressed genes (SAM FDR<0.023%; n=228) in the FRDA children and FRDA adults (overlap p≤0.007). C=control; P=patient. (C) A selected list of significant GO groups representing the overlap gene list described in (B). All controls used for comparison to the FRDA children are young adults (see Table S1). The percent of total (displayed with a gray ball) is based on the number of significantly changed genes out of the total number of genes assigned to each gene ontology term. The gene number for each GO group is shown with a blue bar, the intensity of which is indicative of the p-value.
Copyright
Copyright This is an open-access article distributed under the terms of the Creative Commons Public Domain declaration which stipulates that, once placed in the public domain, this work may be freely reproduced, distributed, transmitted, modified, built upon, or otherwise used by anyone for any lawful purpose.
Reference: <pubmed>20090835</pubmed>| [1]
File history
Click on a date/time to view the file as it appeared at that time.
| Date/Time | Thumbnail | Dimensions | User | Comment | |
|---|---|---|---|---|---|
| current | 23:41, 15 August 2011 | 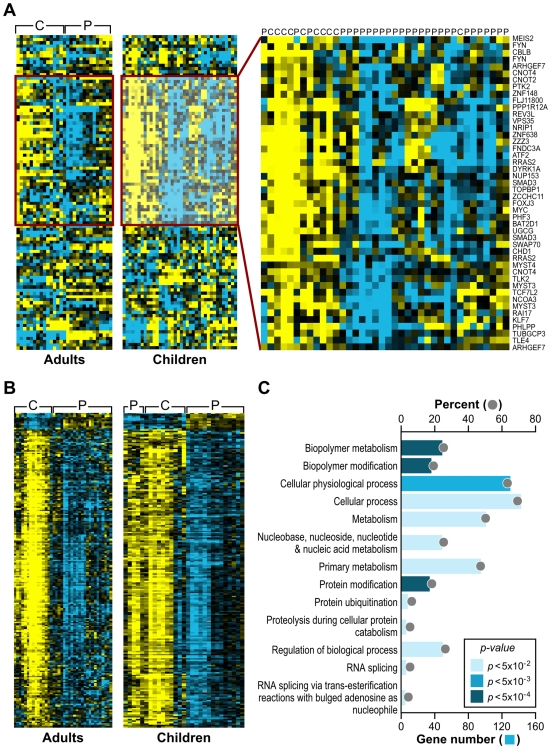 | 551 × 749 (342 KB) | Z3332250 (talk | contribs) | '''Gene expression responses of Friedreich's ataxia''' ---- ==Analogous gene expression responses in blood from children and adults with FRDA.== ---- (A) A common gene signature is representative of a genotoxic stress response found by Gene Set Analysis. |
You cannot overwrite this file.
File usage
The following 3 pages use this file: