File:FISH for DiGeorge Syndrome.jpg: Difference between revisions
(Figure 2 FISH analysis of the proband using a probe (labeled red) specific for DiGeorge Syndrome critical region (TUPLE). A single red signal (white arrow) can be seen on the normal chromosome 22, while the red signal is absent on the chromosome 22 with t) |
No edit summary |
||
| Line 1: | Line 1: | ||
Figure 2 | Figure 2 | ||
FISH analysis of the proband using a probe (labeled red) specific for DiGeorge Syndrome critical region (TUPLE). A single red signal (white arrow) can be seen on the normal chromosome 22, while the red signal is absent on the chromosome 22 with the deletion. Two green signals are seen on the subtelomeres of both homologues (control probe). | FISH analysis of the proband using a probe (labeled red) specific for DiGeorge Syndrome critical region (TUPLE). A single red signal (white arrow) can be seen on the normal chromosome 22, while the red signal is absent on the chromosome 22 with the deletion. Two green signals are seen on the subtelomeres of both homologues (control probe). | ||
Manolakos. E. Sarri. C, Vetro. A, Kefalas. K, Leze. E, Sofocleus. C, Kitsos. G, Merou. K, Kokotas. H, Papadopoulou. A, Attilakos. A, Petersen. M, Kitsiou-Tzeli. S (2011) Combined 22q11.1-q11.21 deletion with 15q11.2-q13.3 duplication identified by array-CGH in a 6 years old. Molecular Cytogenetics. 4: 6 | |||
Link: http://www.ncbi.nlm.nih.gov/pmc/articles/PMC3058102/figure/F2/ | Link: http://www.ncbi.nlm.nih.gov/pmc/articles/PMC3058102/figure/F2/ | ||
Revision as of 11:52, 5 October 2011
Figure 2
FISH analysis of the proband using a probe (labeled red) specific for DiGeorge Syndrome critical region (TUPLE). A single red signal (white arrow) can be seen on the normal chromosome 22, while the red signal is absent on the chromosome 22 with the deletion. Two green signals are seen on the subtelomeres of both homologues (control probe).
Manolakos. E. Sarri. C, Vetro. A, Kefalas. K, Leze. E, Sofocleus. C, Kitsos. G, Merou. K, Kokotas. H, Papadopoulou. A, Attilakos. A, Petersen. M, Kitsiou-Tzeli. S (2011) Combined 22q11.1-q11.21 deletion with 15q11.2-q13.3 duplication identified by array-CGH in a 6 years old. Molecular Cytogenetics. 4: 6
Link: http://www.ncbi.nlm.nih.gov/pmc/articles/PMC3058102/figure/F2/
Copyright ©2011 Manolakos et al; licensee BioMed Central Ltd.
This is an Open Access article distributed under the terms of the Creative Commons Attribution License (http://creativecommons.org/licenses/by/2.0), which permits unrestricted use, distribution, and reproduction in any medium, provided the original work is properly cited.
File history
Click on a date/time to view the file as it appeared at that time.
| Date/Time | Thumbnail | Dimensions | User | Comment | |
|---|---|---|---|---|---|
| current | 00:05, 17 August 2011 | 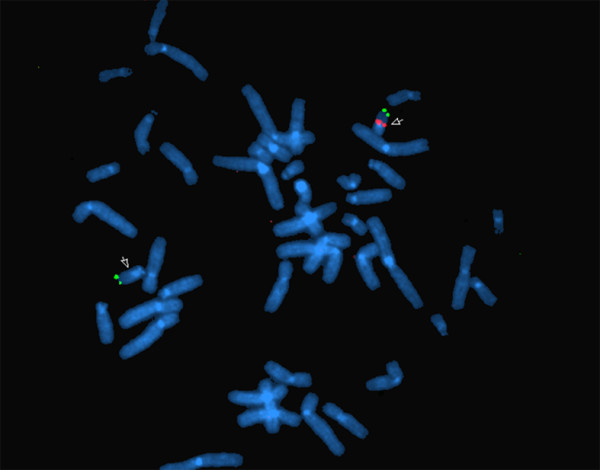 | 600 × 470 (31 KB) | Z3288827 (talk | contribs) | Figure 2 FISH analysis of the proband using a probe (labeled red) specific for DiGeorge Syndrome critical region (TUPLE). A single red signal (white arrow) can be seen on the normal chromosome 22, while the red signal is absent on the chromosome 22 with t |
You cannot overwrite this file.
File usage
The following 3 pages use this file: