File:Distribution of quantitative transcription of genes deleted in WS.png
Distribution_of_quantitative_transcription_of_genes_deleted_in_WS.png (600 × 201 pixels, file size: 90 KB, MIME type: image/png)
Distribution of quantitative transcription of genes deleted in WS
Journal.pone.0010292.g001.png
http://www.plosone.org/article/info%3Adoi%2F10.1371%2Fjournal.pone.0010292
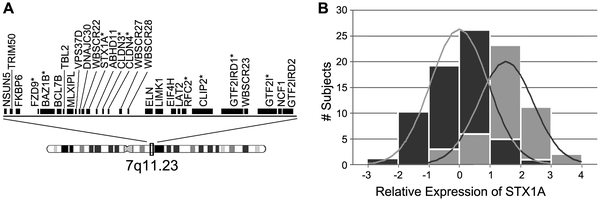
Figure 1. Distribution of quantitative transcription of genes deleted in WS. a: Map of genes commonly deleted in WS. Genes analyzed in this report are indicated with an asterisk. b: Z-scores (relative to the WS mean) of STX1A expression levels. STX1A measured by quantitative RT-PCR of lymphoblast cDNA in 62 WS subjects [14] (dark gray) and 45 normal controls [14] (light gray). The expression level distributions of the remaining WS-deleted genes are shown in Figure S1.
Copyright: © 2010 Gao et al. This is an open-access article distributed under the terms of the Creative Commons Attribution License, which permits unrestricted use, distribution, and reproduction in any medium, provided the original author and source are credited.
File history
Click on a date/time to view the file as it appeared at that time.
| Date/Time | Thumbnail | Dimensions | User | Comment | |
|---|---|---|---|---|---|
| current | 13:18, 11 August 2011 | 600 × 201 (90 KB) | Z3331556 (talk | contribs) | Journal.pone.0010292.g001.png http://www.plosone.org/article/info%3Adoi%2F10.1371%2Fjournal.pone.0010292 Figure 1. Distribution of quantitative transcription of genes deleted in WS. a: Map of genes commonly deleted in WS. Genes analyzed in this report a |
You cannot overwrite this file.
File usage
The following 3 pages use this file: