File:Differentially expressed RefSeq genes in human trisomy 21.jpg
Original file (661 × 847 pixels, file size: 171 KB, MIME type: image/jpeg)
Differentially expressed RefSeq genes in human trisomy 2
Pone.0018493.g006.jpg
http://www.ncbi.nlm.nih.gov/pmc/articles/PMC3080369/
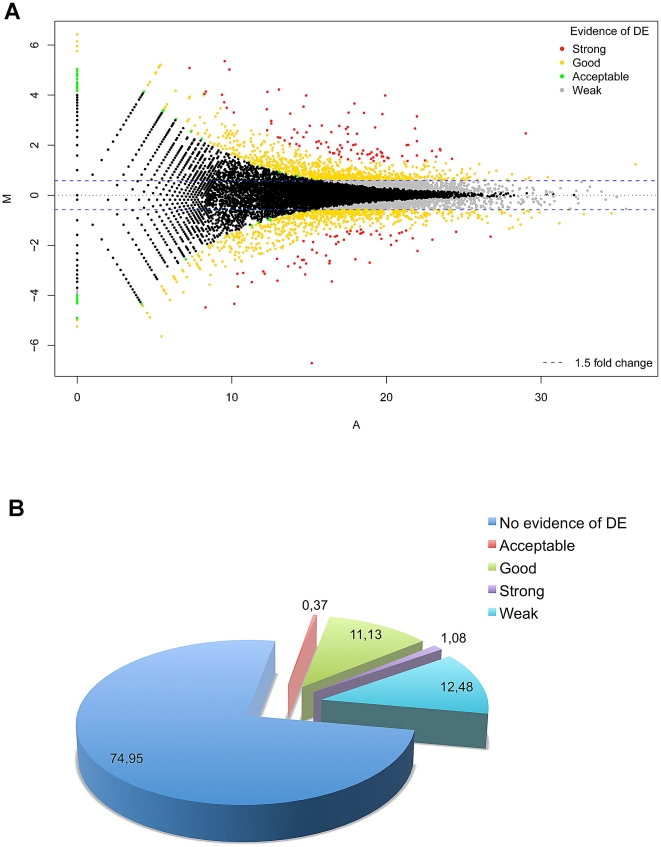
Figure 6 Differentially expressed RefSeq genes in human trisomy 21. (A) Standard MA-plot of the normalized global observed counts per each RefSeq gene. (B) shows the percentage of RefSeq genes classified as strong, good, acceptable evidence of DE with respect to those not showing any statistical evidence.
Copyright Costa et al. This is an open-access article distributed under the terms of the Creative Commons Attribution License, which permits unrestricted use, distribution, and reproduction in any medium, provided the original author and source are credited.
File history
Click on a date/time to view the file as it appeared at that time.
| Date/Time | Thumbnail | Dimensions | User | Comment | |
|---|---|---|---|---|---|
| current | 18:33, 11 August 2011 | | 661 × 847 (171 KB) | MarkHill (talk | contribs) | Reverted to version as of 02:46, 11 August 2011 |
| 12:59, 11 August 2011 |  | 661 × 847 (171 KB) | Z3332629 (talk | contribs) | File:Differentially expressed RefSeq genes in human trisomy 21.jpg Figure 6 Differentially expressed RefSeq genes in human trisomy 21. (A) Standard MA-plot of the normalized global observed counts per each RefSeq gene. (B) shows the percentage of R | |
| 12:46, 11 August 2011 |  | 661 × 847 (171 KB) | S8600021 (talk | contribs) | Pone.0018493.g006.jpg http://www.ncbi.nlm.nih.gov/pmc/articles/PMC3080369/ Figure 6 Differentially expressed RefSeq genes in human trisomy 21. (A) Standard MA-plot of the normalized global observed counts per each RefSeq gene. (B) shows the percentage o |
You cannot overwrite this file.
File usage
The following 22 pages use this file:
- Test Student 2011
- User:Z3272325
- User:Z3279511
- User:Z3284061
- User:Z3289991
- User:Z3290689
- User:Z3290808
- User:Z3290815
- User:Z3290841
- User:Z3291423
- User:Z3292953
- User:Z3294943
- User:Z3308965
- User:Z3308968
- User:Z3329495
- User:Z3330313
- User:Z3331556
- User:Z3332183
- User:Z3332250
- User:Z3332327
- User:Z3332629
- User:Z3389343