File:Average length of the mouse embryo.JPG: Difference between revisions
(This table illustrates the average length of the mouse embryo throughout its embryonic development. copyright and author) |
No edit summary |
||
| Line 1: | Line 1: | ||
This | This graph illustrates the average length of the mouse embryo throughout its embryonic development. | ||
A tabulated form of the graph is shown below | |||
{| {{table}} | |||
| align="center" style="background:#f0f0f0;"|'''Day''' | |||
| align="center" style="background:#f0f0f0;"|'''Length''' | |||
|- | |||
| 0||0.06 | |||
|- | |||
| 1||0.064 | |||
|- | |||
| 2||0.07 | |||
|- | |||
| 3||0.07 | |||
|- | |||
| 4||0.075 | |||
|- | |||
| 5||0.1 | |||
|- | |||
| 6||0.75 | |||
|- | |||
| 7||1.25 | |||
|- | |||
| 8||2.5 | |||
|- | |||
| 9||3.9 | |||
|- | |||
| 10||4.9 | |||
|- | |||
| 11||7 | |||
|- | |||
| 12||9 | |||
|- | |||
| 13||11 | |||
|- | |||
| 14||12 | |||
|- | |||
| 15||14 | |||
|- | |||
| 16||17 | |||
|- | |||
| 17||20 | |||
|- | |||
| 18||23 | |||
|- | |||
| 19||27 | |||
|- | |||
| | |||
|} | |||
Day Length | |||
0 0.06 | |||
1 0.064 | |||
2 0.07 | |||
3 0.07 | |||
4 0.075 | |||
5 0.1 | |||
6 0.75 | |||
7 1.25 | |||
8 2.5 | |||
9 3.9 | |||
10 4.9 | |||
11 7 | |||
12 9 | |||
13 11 | |||
14 12 | |||
15 14 | |||
16 17 | |||
17 20 | |||
18 23 | |||
19 27 | |||
20 27 | |||
Tabulated by z3252340, Based upon information in Dr Karl Theiler’s ‘The House Mouse; Atlas of Embryonic Development’, 1989 | |||
"Beginning six months after publication, I, z3252340, grant the public the non-exclusive right to copy, distribute, or display the Work under a Creative Commons Attribution-Noncommercial-Share Alike 3.0 Unported license, as described at http://creativecommons.org/licenses/by-nc-sa/3.0/ and http://creativecommons.org/licenses/by-nc-sa/3.0/legalcode." | |||
Revision as of 18:57, 21 September 2009
This graph illustrates the average length of the mouse embryo throughout its embryonic development.
A tabulated form of the graph is shown below
| Day | Length |
| 0 | 0.06 |
| 1 | 0.064 |
| 2 | 0.07 |
| 3 | 0.07 |
| 4 | 0.075 |
| 5 | 0.1 |
| 6 | 0.75 |
| 7 | 1.25 |
| 8 | 2.5 |
| 9 | 3.9 |
| 10 | 4.9 |
| 11 | 7 |
| 12 | 9 |
| 13 | 11 |
| 14 | 12 |
| 15 | 14 |
| 16 | 17 |
| 17 | 20 |
| 18 | 23 |
| 19 | 27 |
Day Length
0 0.06
1 0.064
2 0.07
3 0.07
4 0.075
5 0.1
6 0.75
7 1.25
8 2.5
9 3.9
10 4.9
11 7
12 9
13 11
14 12
15 14
16 17
17 20
18 23
19 27
20 27
Tabulated by z3252340, Based upon information in Dr Karl Theiler’s ‘The House Mouse; Atlas of Embryonic Development’, 1989
"Beginning six months after publication, I, z3252340, grant the public the non-exclusive right to copy, distribute, or display the Work under a Creative Commons Attribution-Noncommercial-Share Alike 3.0 Unported license, as described at http://creativecommons.org/licenses/by-nc-sa/3.0/ and http://creativecommons.org/licenses/by-nc-sa/3.0/legalcode."
File history
Click on a date/time to view the file as it appeared at that time.
| Date/Time | Thumbnail | Dimensions | User | Comment | |
|---|---|---|---|---|---|
| current | 09:29, 19 September 2009 | 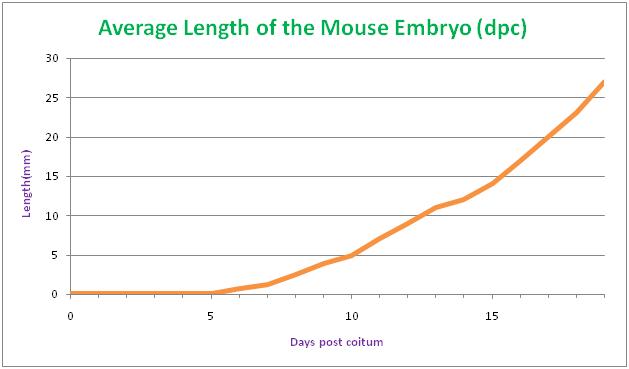 | 629 × 369 (23 KB) | Z3252340 (talk | contribs) | This table illustrates the average length of the mouse embryo throughout its embryonic development. copyright and author |
You cannot overwrite this file.
File usage
The following page uses this file: