File:Abnormal81-92-neuron.png: Difference between revisions
No edit summary |
No edit summary |
||
| Line 14: | Line 14: | ||
[[Category:Prenatal Diagnosis]] [[Category:Abnormal Development]] [[Category:Genetic Abnormalities]] [[Category:Human Embryo]] [[Category:Human Fetus]] | [[Category:Prenatal Diagnosis]] [[Category:Abnormal Development]] [[Category:Genetic Abnormalities]] [[Category:Human Embryo]] [[Category:Human Fetus]] | ||
[[Category:Neural]] | [[Category:Neural]] [[Category:Statistics]] | ||
Revision as of 11:45, 12 August 2009
Pie diagram shows the percentage of neural defects of all notifiable birth defects in Australia.
Data groupings and classification as Major or Minor Abnormalities are based on that used by the Australian Institute of Health and Welfare National Perinatal Statistics Unit, UNSW and published in Congenital Malformations Australia 1981-92.
For individual systems, data shown as a % of all Major Abnormalities based upon published statistics using the same groupings as CMA 81-92. Please note that some congenital diseases involve more than one system.
Reference: Original Data source for graphs from Congenital Malformations Australia 1981-1992, P. Lancaster and E. Pedisich, ISSN 1321-8352.
Image Source: UNSW Embryology
File history
Click on a date/time to view the file as it appeared at that time.
| Date/Time | Thumbnail | Dimensions | User | Comment | |
|---|---|---|---|---|---|
| current | 11:42, 12 August 2009 | 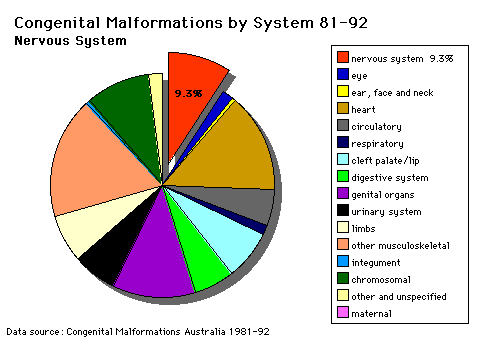 | 481 × 344 (9 KB) | MarkHill (talk | contribs) | Pie diagram shows the percentage of neural defects of all notifiable birth defects in Australia. Data groupings and classification as Major or Minor Abnormalities are based on that used by the Australian Institute of Health and Welfare National Perinatal |
You cannot overwrite this file.
File usage
The following 12 pages use this file:
- 2009 Lecture 6
- 2010 BGD Practical 6 - Week 4
- 2010 Group Project 3
- 2010 Lab 3
- 2010 Lecture 6
- 2011 Lab 3 - Abnormalities
- ANAT2341 Lab 3 - Abnormalities
- BGDA Lecture - Development of the Nervous System
- BGDA Practical 7 - Week 4
- Lecture - Ectoderm Development
- Neural System - Abnormalities
- Talk:2011 Lab 3