Embryology Statistics
Introduction
There are many different types of statistical analyses carried out in relation to normal and abnormal development. The best place to start is with the normal birth statistics.
| Statistics Links: Introduction | Reports | World Population | World Fertility | World Infant Mortality | Maternal Mortality | Australia | Brazil | Canada | China | Germany | India | Indonesia | Europe | Myanmar | Netherlands | Spain | United Kingdom | Romania | Uganda | United States | BGD Tutorial - Applied Embryology and Teratology | National Perinatal Statistics Unit | AIHW | Category:Statistics | |
|
Some Recent Findings
World
--Mark Hill 10:01, 3 June 2011 (EST) The original site had a country by country breakdown of statistics related to embryology, fertility, birth, populations and neonatal health. I am gradually updating and transferring these pages to the new site to allow comparison of data. WHO has a similar statistical analysis of some data, shown below is some historic data from The World Health Report (1998).
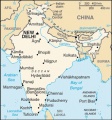
- Links: Australia | Canada | India | United Kingdom | United States | original page Country Comparisons 1997/98]
The World Health Report (1998)
Population
- The global population was 2.8 billion in 1955 and is 5.8 billion now. It will increase by nearly 80 million people a year to reach about 8 billion by the year 2025.
- In 1955, 68% of the global population lived in rural areas and 32% in urban areas. (In 1995 the ratio was 55% rural and 45% urban; by 2025 it will be 41% rural and 59% urban).
- Every day in 1997, about 365 000 babies were born, and about 140 000 people died, giving a natural increase of about 220 000 people a day.
- Today's population is made up of 613 million children under 5; 1.7 billion children and adolescents aged 5-19; 3.1 billion adults aged 20-64; and 390 million over 65.
- The proportion of older people requiring support from adults of working age will increase from 10.5% in 1955 and 12.3% in 1995 to 17.2% in 2025.
- In 1955, there were 12 people aged over 65 for every 100 aged under 20. By 1995, the old/young ratio was 16/100; by 2025 it will be 31/100.
- The proportion of young people under 20 years will fall from 40% now to 32% of the total population by 2025, despite reaching 2.6 billion - an actual increase of 252 million.
- The number of people aged over 65 will rise from 390 million now to 800 million by 2025 - reaching 10% of the total population.
- By 2025, increases of up to 300% of the older population are expected in many developing countries, especially in Latin America and Asia.
- Globally, the population of children under 5 will grow by just 0.25% annually between 1995-2025, while the population over 65 years will grow by 2.6%.
- The average number of babies per woman of child-bearing age was 5.0 in 1955, falling to 2.9 in 1995 and reaching 2.3 in 2025. While only 3 countries were below the population replacement level of 2.1 babies in 1955, there will be 102 such countries by 2025.
Health of Infants and Small Children
- Spectacular progress in reducing under 5 mortality achieved in the last few decades is projected to continue. There were about 10 million such deaths in 1997 compared to 21 million in 1955.
- The infant mortality rate per 1000 live births was 148 in 1955; 59 in 1995; and is projected to be 29 in 2025. The under-5 mortality rates per 1000 live births for the same years are 210, 78 and 37 respectively.
- By 2025 there will still be 5 million deaths among children under five - 97% of them in the developing world, and most of them due to infectious diseases such as pneumonia and diarrhoea, combined with malnutrition.
- There are still 24 million low-birthweight babies born every year. They are more likely to die early, and those who survive may suffer illness, stunted growth or even problems into adult life.
- In 1995, 27% (168 million) of all children under 5 were underweight. Mortality rates are 5 times higher among severely underweight children than those of normal weight.
- About 50% of deaths among children under 5 are associated with malnutrition.
- At least two million a year of the under-five deaths could be prevented by existing vaccines. Most of the rest are preventable by other means.
Life Expectancy
- Average life expectancy at birth in 1955 was just 48 years; in 1995 it was 65 years; in 2025 it will reach 73 years.
- By the year 2025, it is expected that no country will have a life expectancy of less than 50 years.
- More than 50 million people live today in countries with a life expectancy of less than 45 years.
- Over 5 billion people in 120 countries today have life expectancy of more than 60 years.
- About 300 million people live in 16 countries where life expectancy actually decreased between 1975-1995.
- Many thousands of people born this year will live through the 21st century and see the advent of the 22nd century. For example, while there were only 200 centenarians in France in 1950, by the year 2050, the number is projected to reach 150 000 - a 750-fold increase in 100 years.
- Data: The World Health Report Published by WHO, 11 May 1998 ISBN 92 4 156189 0. WHO
Europe
Eurocat is a European network of population-based registries for the epidemiologic surveillance of congenital anomalies. Started in 1979 with more than 1.5 million births surveyed per year in Europe, 43 registries in 20 countries, and 29% of European birth population covered. High quality multiple source registries, ascertaining terminations of pregnancy as well as births.
- Links: eurocat
Australia
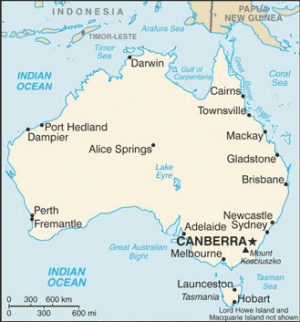
Australia's mothers and babies is an annual report providing information on births in Australia from perinatal data collections for each state and territory. The report presents demographic, pregnancy and childbirth factors of women who gave birth in that year and the characteristics and outcomes of their babies.
- Links: Australia | Australia’s mothers and babies 2008 | Australia’s mothers and babies 2007 | Abnormal Development - Australian Statistics | BGD Tutorial - Applied Embryology and Teratology |
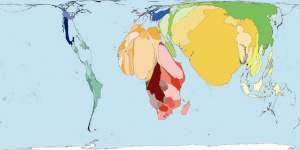
World Population
| Rank | Country | Population |
| 1 | China | 1,336,718,015 |
| 2 | India | 1,189,172,906 |
| 3 | United States | 313,232,044 |
| 4 | Indonesia | 245,613,043 |
| 5 | Brazil | 203,429,773 |
| 6 | Pakistan | 187,342,721 |
| 7 | Bangladesh | 158,570,535 |
| 8 | Nigeria | 155,215,573 |
| 9 | Russia | 138,739,892 |
| 10 | Japan | 126,475,664 |
| 11 | Mexico | 113,724,226 |
| 12 | Philippines | 101,833,938 |
| 13 | Ethiopia | 90,873,739 |
| 14 | Vietnam | 90,549,390 |
| 15 | Egypt | 82,079,636 |
| 16 | Germany | 81,471,834 |
| 17 | Turkey | 78,785,548 |
| 18 | Iran | 77,891,220 |
| 19 | Congo, Democratic Republic of the | 71,712,867 |
| 20 | Thailand | 66,720,153 |
| 21 | France | 65,312,249 |
| 22 | United Kingdom | 62,698,362 |
| 23 | Italy | 61,016,804 |
| 24 | Burma | 53,999,804 |
| 25 | South Africa | 49,004,031 |
| 26 | Korea, South | 48,754,657 |
| 27 | Spain | 46,754,784 |
| 28 | Ukraine | 45,134,707 |
| 29 | Sudan | 45,047,502 |
| 30 | Colombia | 44,725,543 |
| 31 | Tanzania | 42,746,620 |
| 32 | Argentina | 41,769,726 |
| 33 | Kenya | 41,070,934 |
| 34 | Poland | 38,441,588 |
| 35 | Algeria | 34,994,937 |
| 36 | Uganda | 34,612,250 |
| 37 | Canada | 34,030,589 |
| 38 | Morocco | 31,968,361 |
| 39 | Iraq | 30,399,572 |
| 40 | Afghanistan | 29,835,392 |
| 41 | Nepal | 29,391,883 |
| 42 | Peru | 29,248,943 |
| 43 | Malaysia | 28,728,607 |
| 44 | Uzbekistan | 28,128,600 |
| 45 | Venezuela | 27,635,743 |
| 46 | Saudi Arabia | 26,131,703 |
| 47 | Ghana | 24,791,073 |
| 48 | Korea, North | 24,457,492 |
| 49 | Yemen | 24,133,492 |
| 50 | Taiwan | 23,071,779 |
| 51 | Mozambique | 22,948,858 |
| 52 | Syria | 22,517,750 |
| 53 | Madagascar | 21,926,221 |
| 54 | Romania | 21,904,551 |
| 55 | Australia | 21,766,711 |
| 56 | Cote d'Ivoire | 21,504,162 |
| 57 | Sri Lanka | 21,283,913 |
| 58 | Cameroon | 19,711,291 |
| 59 | Chile | 16,888,760 |
| 60 | Netherlands | 16,847,007 |
| 61 | Burkina Faso | 16,751,455 |
| 62 | Niger | 16,468,886 |
| 63 | Malawi | 15,879,252 |
| 64 | Kazakhstan | 15,522,373 |
| 65 | Ecuador | 15,007,343 |
| 66 | Cambodia | 14,701,717 |
| 67 | Mali | 14,159,904 |
| 68 | Zambia | 13,881,336 |
| 69 | Guatemala | 13,824,463 |
| 70 | Angola | 13,338,541 |
| 71 | Senegal | 12,643,799 |
| 72 | Zimbabwe | 12,084,304 |
| 73 | Rwanda | 11,370,425 |
| 74 | Cuba | 11,087,330 |
| 75 | Portugal | 10,760,305 |
| 76 | Greece | 10,760,136 |
| 77 | Chad | 10,758,945 |
| 78 | Tunisia | 10,629,186 |
| 79 | Guinea | 10,601,009 |
| 80 | Belgium | 10,431,477 |
| 81 | Burundi | 10,216,190 |
| 82 | Czech Republic | 10,190,213 |
| 83 | Bolivia | 10,118,683 |
| 84 | Hungary | 9,976,062 |
| 85 | Dominican Republic | 9,956,648 |
| 86 | Somalia | 9,925,640 |
| 87 | Haiti | 9,719,932 |
| 88 | Belarus | 9,577,552 |
| 89 | Benin | 9,325,032 |
| 90 | Sweden | 9,088,728 |
| 91 | Azerbaijan | 8,372,373 |
| 92 | Austria | 8,217,280 |
| 93 | Honduras | 8,143,564 |
| 94 | Switzerland | 7,639,961 |
| 95 | Tajikistan | 7,627,200 |
| 96 | Israel | 7,473,052 |
| 97 | Serbia | 7,310,555 |
| 98 | Hong Kong | 7,122,508 |
| 99 | Bulgaria | 7,093,635 |
| 100 | Togo | 6,771,993 |
| 101 | Libya | 6,597,960 |
| 102 | Jordan | 6,508,271 |
| 103 | Laos | 6,477,211 |
| 104 | Paraguay | 6,459,058 |
| 105 | Papua New Guinea | 6,187,591 |
| 106 | El Salvador | 6,071,774 |
| 107 | Eritrea | 5,939,484 |
| 108 | Nicaragua | 5,666,301 |
| 109 | Kyrgyzstan | 5,587,443 |
| 110 | Denmark | 5,529,888 |
| 111 | Slovakia | 5,477,038 |
| 112 | Sierra Leone | 5,363,669 |
| 113 | Finland | 5,259,250 |
| 114 | United Arab Emirates | 5,148,664 |
| 115 | Turkmenistan | 4,997,503 |
| 116 | Central African Republic | 4,950,027 |
| 117 | Singapore | 4,740,737 |
| 118 | Norway | 4,691,849 |
| 119 | Ireland | 4,670,976 |
| 120 | Bosnia and Herzegovina | 4,622,163 |
| 121 | Georgia | 4,585,874 |
| 122 | Costa Rica | 4,576,562 |
| 123 | Croatia | 4,483,804 |
| 124 | Moldova | 4,314,377 |
| 125 | New Zealand | 4,290,347 |
| 126 | Congo, Republic of the | 4,243,929 |
| 127 | Lebanon | 4,143,101 |
| 128 | Puerto Rico | 3,989,133 |
| 129 | Liberia | 3,786,764 |
| 130 | Lithuania | 3,535,547 |
| 131 | Panama | 3,460,462 |
| 132 | Uruguay | 3,308,535 |
| 133 | Mauritania | 3,281,634 |
| 134 | Mongolia | 3,133,318 |
| 135 | Oman | 3,027,959 |
| 136 | Albania | 2,994,667 |
| 137 | Armenia | 2,967,975 |
| 138 | Jamaica | 2,868,380 |
| 139 | Kuwait | 2,595,628 |
| 140 | West Bank | 2,568,555 |
| 141 | Latvia | 2,204,708 |
| 142 | Namibia | 2,147,585 |
| 143 | Macedonia | 2,077,328 |
| 144 | Botswana | 2,065,398 |
| 145 | Slovenia | 2,000,092 |
| 146 | Lesotho | 1,924,886 |
| 147 | Kosovo | 1,825,632 |
| 148 | Gambia, The | 1,797,860 |
| 149 | Gaza Strip | 1,657,155 |
| 150 | Guinea-Bissau | 1,596,677 |
| 151 | Gabon | 1,576,665 |
| 152 | Swaziland | 1,370,424 |
| 153 | Mauritius | 1,303,717 |
| 154 | Estonia | 1,282,963 |
| 155 | Trinidad and Tobago | 1,227,505 |
| 156 | Bahrain | 1,214,705 |
| 157 | Timor-Leste | 1,177,834 |
| 158 | Cyprus | 1,120,489 |
| 159 | Fiji | 883,125 |
| 160 | Qatar | 848,016 |
| 161 | Comoros | 794,683 |
| 162 | Djibouti | 757,074 |
| 163 | Guyana | 744,768 |
| 164 | Bhutan | 708,427 |
| 165 | Equatorial Guinea | 668,225 |
| 166 | Montenegro | 661,807 |
| 167 | Macau | 573,003 |
| 168 | Solomon Islands | 571,890 |
| 169 | Cape Verde | 516,100 |
| 170 | Western Sahara | 507,160 |
| 171 | Luxembourg | 503,302 |
| 172 | Suriname | 491,989 |
| 173 | Malta | 408,333 |
| 174 | Brunei | 401,890 |
| 175 | Maldives | 394,999 |
| 176 | Belize | 321,115 |
| 177 | Bahamas, The | 313,312 |
| 178 | Iceland | 311,058 |
| 179 | French Polynesia | 294,935 |
| 180 | Barbados | 286,705 |
| 181 | New Caledonia | 256,275 |
| 182 | Vanuatu | 224,564 |
| 183 | Samoa | 193,161 |
| 184 | Sao Tome and Principe | 179,506 |
| 185 | Saint Lucia | 161,557 |
| 186 | Curacao | 142,180 |
| 187 | Virgin Islands | 109,666 |
| 188 | Grenada | 108,419 |
| 189 | Micronesia, Federated States of | 106,836 |
| 190 | Aruba | 106,113 |
| 191 | Tonga | 105,916 |
| 192 | Saint Vincent and the Grenadines | 103,869 |
| 193 | Kiribati | 100,743 |
| 194 | Jersey | 94,161 |
| 195 | Seychelles | 89,188 |
| 196 | Antigua and Barbuda | 87,884 |
| 197 | Andorra | 84,825 |
| 198 | Isle of Man | 84,655 |
| 199 | Dominica | 72,969 |
| 200 | Bermuda | 68,679 |
| 201 | American Samoa | 67,242 |
| 202 | Marshall Islands | 67,182 |
| 203 | Guernsey | 65,068 |
| 204 | Greenland | 57,670 |
| 205 | Cayman Islands | 51,384 |
| 206 | Saint Kitts and Nevis | 50,314 |
| 207 | Faroe Islands | 49,267 |
| 208 | Northern Mariana Islands | 46,050 |
| 209 | Turks and Caicos Islands | 44,819 |
| 210 | Sint Maarten | 37,429 |
| 211 | Liechtenstein | 35,236 |
| 212 | San Marino | 31,817 |
| 213 | Saint Martin | 30,615 |
| 214 | Monaco | 30,539 |
| 215 | Gibraltar | 28,956 |
| 216 | British Virgin Islands | 25,383 |
| 217 | Palau | 20,956 |
| 218 | Akrotiri | 15,700 |
| 219 | Dhekelia | 15,700 |
| 220 | Wallis and Futuna | 15,398 |
| 221 | Anguilla | 15,094 |
| 222 | Cook Islands | 11,124 |
| 223 | Tuvalu | 10,544 |
| 224 | Nauru | 9,322 |
| 225 | Saint Helena, Ascension, and Tristan da Cunha |
7,700 |
| 226 | Saint Barthelemy | 7,367 |
| 227 | Saint Pierre and Miquelon | 5,888 |
| 228 | Montserrat | 5,140 |
| 229 | Falkland Islands (Islas Malvinas) | 3,140 |
| 230 | Norfolk Island | 2,169 |
| 231 | Svalbard | 2,019 |
| 232 | Christmas Island | 1,402 |
| 233 | Tokelau | 1,384 |
| 234 | Niue | 1,311 |
| 235 | Holy See (Vatican City) | 832 |
| 236 | Cocos (Keeling) Islands | 596 |
| 237 | Pitcairn Islands | 48 |
Glossary Links
- Glossary: A | B | C | D | E | F | G | H | I | J | K | L | M | N | O | P | Q | R | S | T | U | V | W | X | Y | Z | Numbers | Symbols | Term Link
Cite this page: Hill, M.A. (2024, April 16) Embryology Embryology Statistics. Retrieved from https://embryology.med.unsw.edu.au/embryology/index.php/Embryology_Statistics
- © Dr Mark Hill 2024, UNSW Embryology ISBN: 978 0 7334 2609 4 - UNSW CRICOS Provider Code No. 00098G


