Australia’s mothers and babies 2017: Difference between revisions
mNo edit summary |
mNo edit summary |
||
| (4 intermediate revisions by the same user not shown) | |||
| Line 4: | Line 4: | ||
[https://www.aihw.gov.au/reports/mothers-babies/australias-mothers-and-babies-2017-in-brief/contents/table-of-contents Australia's mothers and babies 2017—in brief] [27 June 2019]<ref name=AMB2017>{{Ref-AMB2017}}</ref> | [https://www.aihw.gov.au/reports/mothers-babies/australias-mothers-and-babies-2017-in-brief/contents/table-of-contents Australia's mothers and babies 2017—in brief] [27 June 2019]<ref name=AMB2017>{{Ref-AMB2017}}</ref> | ||
* In 2017, 301,095 women gave birth in Australia, an increase of 4.0% since 2007. | * In 2017, 301,095 women gave birth in [[Australian Statistics|Australia]], an increase of 4.0% since 2007. | ||
* 13% of women who gave birth in 2017 had gestational diabetes | * 30.6 was the average {{maternal age}} of all women who gave birth, compared with 29.9 in 2007. | ||
* 1 in 3 mothers had a caesarean section in 2017 | * 13% of women who gave birth in 2017 had {{gestational diabetes}} | ||
* 6.7% of liveborn babies were low birthweight in 2017 | * 1 in 3 mothers had a {{caesarean}} section in 2017 | ||
* 6.7% of liveborn babies were low {{birthweight}} in 2017 | |||
'''Australian Average Maternal Age Change''' | |||
[[File:Australian-maternal-age-2007-17.jpg|600px|link=Genetic risk maternal age]] | |||
| Line 17: | Line 22: | ||
<br> | <br> | ||
{{Australia mothers and babies links}} | {{Australia mothers and babies links}} | ||
<br> | |||
<gallery> | |||
File:Australia's mothers and babies 2017.jpg|link=Australia’s mothers and babies 2017|2017 | |||
File:Australia's mothers and babies 2016.jpg|link=Australia’s mothers and babies 2016|2016 | |||
File:Australia's mothers and babies 2015.jpg|link=Australia’s mothers and babies 2015|2015 | |||
File:Australia's mothers and babies 2014.jpg|link=Australia’s mothers and babies 2014|2014 | |||
File:Australia mothers and babies 2013.jpg|link=Australia’s mothers and babies 2013|2013 | |||
File:Australia mothers and babies 2012.jpg|link=Australia’s mothers and babies 2012|2012 | |||
File:Australia mothers and babies 2011.jpg|link=Australia’s mothers and babies 2011|2011 | |||
File:Australia mothers and babies 2010.jpg|link=Australia’s mothers and babies 2010|2010 | |||
File:Australia mothers and babies 2009.jpg|link=Australia’s mothers and babies 2009|2009 | |||
</gallery> | |||
<br> | <br> | ||
{{Birth Links}} | {{Birth Links}} | ||
==References== | ==References== | ||
<references/> | <references/> | ||
{{Footer}} | {{Footer}} | ||
[[Category:Australia]][[Category:2019]][[Category:2017]] | [[Category:Australia]][[Category:2019]][[Category:2017]] | ||
Revision as of 15:41, 27 June 2019
| Embryology - 24 Apr 2024 |
|---|
| Google Translate - select your language from the list shown below (this will open a new external page) |
|
العربية | català | 中文 | 中國傳統的 | français | Deutsche | עִברִית | हिंदी | bahasa Indonesia | italiano | 日本語 | 한국어 | မြန်မာ | Pilipino | Polskie | português | ਪੰਜਾਬੀ ਦੇ | Română | русский | Español | Swahili | Svensk | ไทย | Türkçe | اردو | ייִדיש | Tiếng Việt These external translations are automated and may not be accurate. (More? About Translations) |
Introduction
Australia's mothers and babies 2017—in brief [27 June 2019][1]
- In 2017, 301,095 women gave birth in Australia, an increase of 4.0% since 2007.
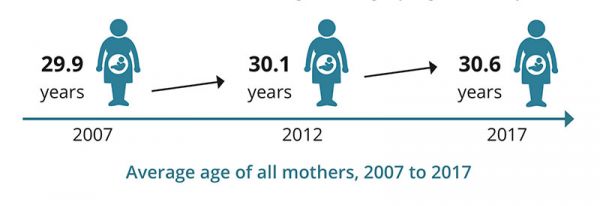
- 30.6 was the average maternal age of all women who gave birth, compared with 29.9 in 2007.
- 13% of women who gave birth in 2017 had gestational diabetes
- 1 in 3 mothers had a caesarean section in 2017
- 6.7% of liveborn babies were low birthweight in 2017
Australian Average Maternal Age Change
Australia's mothers and babies data visualisations [27 June 2019]
- Explore the characteristics and health of mothers and their babies through interactive data visualisations, including in-depth information and trends on the antenatal period, labour, birth and babies outcomes at birth.
| Australia’s mothers and babies: 2017 | 2016 | 2015 | 2014 | 2013 | 2012 | 2011 | 2010 | 2009 | 2008 | 2007 | National Perinatal Statistics Unit | AIHW | Australian Statistics | birth |

2017

2016
2015
2014
2013
2012
2011
2010
2009
References
- ↑ Australian Institute of Health and Welfare 2019. Australia’s mothers and babies 2017—in brief. Perinatal statistics series no. 35. Cat. no. PER 100. Canberra: AIHW.
Cite this page: Hill, M.A. (2024, April 24) Embryology Australia’s mothers and babies 2017. Retrieved from https://embryology.med.unsw.edu.au/embryology/index.php/Australia%E2%80%99s_mothers_and_babies_2017
- © Dr Mark Hill 2024, UNSW Embryology ISBN: 978 0 7334 2609 4 - UNSW CRICOS Provider Code No. 00098G