Australia’s mothers and babies 2007: Difference between revisions
No edit summary |
mNo edit summary |
||
| (35 intermediate revisions by 3 users not shown) | |||
| Line 1: | Line 1: | ||
{{Header}} | |||
== Introduction == | == Introduction == | ||
This data summarised below is provided to help you as a clinician or researcher understand the current trends in reproductive medicine within Australia. | |||
The information | The information is based upon data from the publication "Australia's mothers and babies 2007"<ref>Laws P & Sullivan EA 2009. '''Australia's mothers and babies 2007''' [http://www.aihw.gov.au/publications/index.cfm/title/10972 AIHW Perinatal statistics series no. 23] Cat. no. PER 48. Sydney: AIHW National Perinatal Statistics Unit.</ref> and is provided for educational purposes only. The original full publication is available online from [http://www.aihw.gov.au/publications/index.cfm/title/10972 AIHW Perinatal statistics series no. 23]. | ||
<br> | |||
{{Australia mothers and babies links}} | |||
<br> | |||
{{Birth Links}} | |||
:{{Statistics Links}} | |||
== Mothers == | |||
* '''289,496''' women gave birth resulting in a total of '''294,205''' births | [[Image:Australian-births 2007.png|thumb|Australian Births by Year]] | ||
** increase of 4.3% from 2006, and 14.4% increase since 2004 | * '''289,496''' women gave birth resulting in a total of '''294,205''' births | ||
** increase of 4.3% from 2006, and 14.4% increase since 2004 | |||
* '''2,177''' were fetal deaths | * '''2,177''' were fetal deaths | ||
* '''29.9 years''' was the maternal mean age in 2007 | |||
** compared with 28.9 years in 1998 | |||
* 41.6% of mothers had their first baby and 33.5% had their second baby | |||
* '''10,883''' women were Aboriginal or Torres Strait Islander (3.8% of all women who gave birth) | |||
** 39.5% of all mothers in the Northern Territory | |||
** 25.2 years was the average age of women who gave birth | |||
===Assisted reproduction technology=== | |||
* '''3.1%''' women received ART treatment | |||
** ranging from 1.4% in the Australian Capital Territory to 3.7% in Tasmania | |||
* '''34.1 years''' was the average age of women who received ART | |||
* 62.7% of mothers who received ART treatment were having their first baby and 37.3% had given birth previously | |||
===Smoking during pregnancy=== | |||
* '''16.6%''' of women smoked during pregnancy | |||
** this proportion is little changed over the previous five years | |||
===Preterm birth=== | |||
* 7.4% of all mothers (less than 37 completed weeks of gestation) | |||
** 38.8 weeks is the average duration of pregnancy | |||
===Multiple pregnancy=== | |||
* '''4,634''' multiple pregnancies (1.6% of all mothers) increasing due to the increased use of ART | |||
** 4,558 twin pregnancies | |||
** 76 triplet pregnancies | |||
** no quadruplet pregnancies | |||
===Presentation at birth=== | |||
* 94.6% cephalic (any part vertex, face, or brow of the fetal head) | |||
* 4.0% breech (buttocks or feet) | |||
===Method of birth=== | |||
[[File:Australian_birth_delivery_method_2007.jpg|thumb|350px|Australian birth delivery method]] | |||
* '''57.9%''' vaginal births | |||
* '''11.2%''' had an instrumental vaginal delivery (forceps or vacuum extraction) | |||
* '''30.9%''' caesarean section births | |||
** 21.1% in 1998, 30.8% in 2006, rate recently stable | |||
** 83.3% of these were repeat caesarean sections | |||
===Pre-existing and pregnancy-related medical conditions=== | |||
* epilepsy, diabetes mellitus and hypertension, antepartum haemorrhage, gestational diabetes, cord prolapse and retained placenta, pregnancy-induced hypertension, fetal distress in labour and post-partum haemorrhage rates | |||
===Postnatal length of stay=== | |||
* 2.0 days non-instrumental vaginal birth | |||
* 3.0 days vacuum extraction delivery | |||
* 4.0 days caesarean section or forceps delivery | |||
==Babies== | |||
* '''292,027''' live births and '''2,177''' fetal deaths | |||
** stillbirth rate of 7.4 per 1,000 births | |||
* most births occurred in March, August and October | |||
* '''105.6''' sex ratio (number of male per 100 female liveborn babies) | |||
===Gestational age=== | |||
* '''90.9%''' term (37–41 weeks gestation) | |||
* 8.1% were preterm | |||
* '''33.2 weeks''' was the mean gestational age for all preterm births | |||
** Preterm births were classified groups of 20–27 weeks, 28–31 weeks and 32–36 weeks | |||
===Birthweight=== | |||
* 92.1% of liveborn babies had a birthweight in the range 2,500–4,499 grams | |||
** average birthweight was 3,374 grams | |||
* 17,976 (6.2%) low birthweight (weighing less than 2,500 grams) | |||
* 2,956 (1.0%) very low birthweight (weighing less than 1,500 grams) | |||
* 1,288 (0.4%) extremely low birthweight (weighing less than 1,000 grams) | |||
===Apgar scores=== | |||
* 1.4% of liveborn babies had a low Apgar score (between 0 and 6) at 5 minutes (More? [[Apgar test]]) | |||
===Special care nurseries or neonatal intensive care units=== | |||
* 14.5% of liveborn babies were admitted to an SCN or NICU | |||
==Perinatal mortality== | |||
* 2,177 fetal deaths (7.4 per 1,000 births) | |||
** fetal deaths are if the birthweight is at least 400 grams or the gestational age is 20 weeks or more | |||
* 846 neonatal deaths (2.9 per 1,000 live births) | |||
** neonatal deaths are those occurring in live births up to 28 completed days after birth | |||
* 3,024 perinatal deaths | |||
** perinatal death includes birthweight of at least 400 grams or, where birthweight is unknown, a gestational age of at least 20 weeks | |||
* 23.5% congenital abnormalities (anomalies) | |||
* 13.8% maternal conditions | |||
* 12.6% unexplained antepartum death | |||
==References== | |||
<references/> | |||
[[Category:Statistics]] [[Category:Australia]] [[Category:Report]] | |||
Latest revision as of 13:55, 8 February 2018
| Embryology - 23 Apr 2024 |
|---|
| Google Translate - select your language from the list shown below (this will open a new external page) |
|
العربية | català | 中文 | 中國傳統的 | français | Deutsche | עִברִית | हिंदी | bahasa Indonesia | italiano | 日本語 | 한국어 | မြန်မာ | Pilipino | Polskie | português | ਪੰਜਾਬੀ ਦੇ | Română | русский | Español | Swahili | Svensk | ไทย | Türkçe | اردو | ייִדיש | Tiếng Việt These external translations are automated and may not be accurate. (More? About Translations) |
Introduction
This data summarised below is provided to help you as a clinician or researcher understand the current trends in reproductive medicine within Australia.
The information is based upon data from the publication "Australia's mothers and babies 2007"[1] and is provided for educational purposes only. The original full publication is available online from AIHW Perinatal statistics series no. 23.
| Australia’s mothers and babies: 2017 | 2016 | 2015 | 2014 | 2013 | 2012 | 2011 | 2010 | 2009 | 2008 | 2007 | National Perinatal Statistics Unit | AIHW | Australian Statistics | birth |
| Statistics Links: Introduction | Reports | World Population | World Fertility | World Infant Mortality | Maternal Mortality | Australia | Brazil | Canada | China | Germany | India | Indonesia | Europe | Myanmar | Netherlands | Spain | United Kingdom | Romania | Uganda | United States | BGD Tutorial - Applied Embryology and Teratology | National Perinatal Statistics Unit | AIHW | Category:Statistics | |
|
Mothers
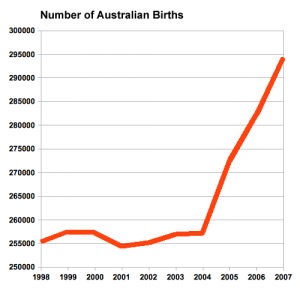
- 289,496 women gave birth resulting in a total of 294,205 births
- increase of 4.3% from 2006, and 14.4% increase since 2004
- 2,177 were fetal deaths
- 29.9 years was the maternal mean age in 2007
- compared with 28.9 years in 1998
- 41.6% of mothers had their first baby and 33.5% had their second baby
- 10,883 women were Aboriginal or Torres Strait Islander (3.8% of all women who gave birth)
- 39.5% of all mothers in the Northern Territory
- 25.2 years was the average age of women who gave birth
Assisted reproduction technology
- 3.1% women received ART treatment
- ranging from 1.4% in the Australian Capital Territory to 3.7% in Tasmania
- 34.1 years was the average age of women who received ART
- 62.7% of mothers who received ART treatment were having their first baby and 37.3% had given birth previously
Smoking during pregnancy
- 16.6% of women smoked during pregnancy
- this proportion is little changed over the previous five years
Preterm birth
- 7.4% of all mothers (less than 37 completed weeks of gestation)
- 38.8 weeks is the average duration of pregnancy
Multiple pregnancy
- 4,634 multiple pregnancies (1.6% of all mothers) increasing due to the increased use of ART
- 4,558 twin pregnancies
- 76 triplet pregnancies
- no quadruplet pregnancies
Presentation at birth
- 94.6% cephalic (any part vertex, face, or brow of the fetal head)
- 4.0% breech (buttocks or feet)
Method of birth
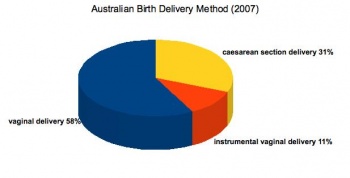
- 57.9% vaginal births
- 11.2% had an instrumental vaginal delivery (forceps or vacuum extraction)
- 30.9% caesarean section births
- 21.1% in 1998, 30.8% in 2006, rate recently stable
- 83.3% of these were repeat caesarean sections
- epilepsy, diabetes mellitus and hypertension, antepartum haemorrhage, gestational diabetes, cord prolapse and retained placenta, pregnancy-induced hypertension, fetal distress in labour and post-partum haemorrhage rates
Postnatal length of stay
- 2.0 days non-instrumental vaginal birth
- 3.0 days vacuum extraction delivery
- 4.0 days caesarean section or forceps delivery
Babies
- 292,027 live births and 2,177 fetal deaths
- stillbirth rate of 7.4 per 1,000 births
- most births occurred in March, August and October
- 105.6 sex ratio (number of male per 100 female liveborn babies)
Gestational age
- 90.9% term (37–41 weeks gestation)
- 8.1% were preterm
- 33.2 weeks was the mean gestational age for all preterm births
- Preterm births were classified groups of 20–27 weeks, 28–31 weeks and 32–36 weeks
Birthweight
- 92.1% of liveborn babies had a birthweight in the range 2,500–4,499 grams
- average birthweight was 3,374 grams
- 17,976 (6.2%) low birthweight (weighing less than 2,500 grams)
- 2,956 (1.0%) very low birthweight (weighing less than 1,500 grams)
- 1,288 (0.4%) extremely low birthweight (weighing less than 1,000 grams)
Apgar scores
- 1.4% of liveborn babies had a low Apgar score (between 0 and 6) at 5 minutes (More? Apgar test)
Special care nurseries or neonatal intensive care units
- 14.5% of liveborn babies were admitted to an SCN or NICU
Perinatal mortality
- 2,177 fetal deaths (7.4 per 1,000 births)
- fetal deaths are if the birthweight is at least 400 grams or the gestational age is 20 weeks or more
- 846 neonatal deaths (2.9 per 1,000 live births)
- neonatal deaths are those occurring in live births up to 28 completed days after birth
- 3,024 perinatal deaths
- perinatal death includes birthweight of at least 400 grams or, where birthweight is unknown, a gestational age of at least 20 weeks
- 23.5% congenital abnormalities (anomalies)
- 13.8% maternal conditions
- 12.6% unexplained antepartum death
References
- ↑ Laws P & Sullivan EA 2009. Australia's mothers and babies 2007 AIHW Perinatal statistics series no. 23 Cat. no. PER 48. Sydney: AIHW National Perinatal Statistics Unit.

