File:Yolk sac and amniotic cavity volume graph.jpg
From Embryology
Size of this preview: 431 × 599 pixels. Other resolution: 719 × 1,000 pixels.
Original file (719 × 1,000 pixels, file size: 50 KB, MIME type: image/jpeg)
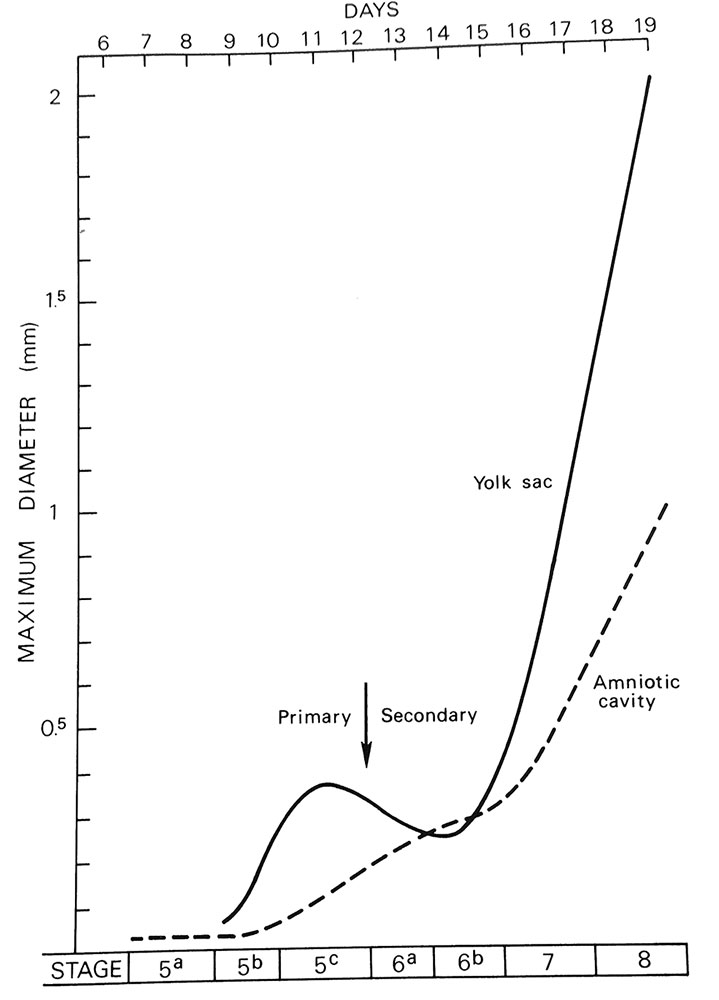
Yolk sac and amniotic cavity volume graph
Change in human embryo extra-embryonic cavity volumes yolk sac and amniotic cavity between week 2 to 3 (stage Carnegie stage 5|5]], 6, 7 and 8).
| Week: | 1 | 2 | 3 | 4 | 5 | 6 | 7 | 8 |
| Carnegie stage: | 1 2 3 4 | 5 6 | 7 8 9 | 10 11 12 13 | 14 15 | 16 17 | 18 19 | 20 21 22 23 |
Cite this page: Hill, M.A. (2024, April 24) Embryology Yolk sac and amniotic cavity volume graph.jpg. Retrieved from https://embryology.med.unsw.edu.au/embryology/index.php/File:Yolk_sac_and_amniotic_cavity_volume_graph.jpg
- © Dr Mark Hill 2024, UNSW Embryology ISBN: 978 0 7334 2609 4 - UNSW CRICOS Provider Code No. 00098G
File history
Click on a date/time to view the file as it appeared at that time.
| Date/Time | Thumbnail | Dimensions | User | Comment | |
|---|---|---|---|---|---|
| current | 07:03, 3 April 2015 | | 719 × 1,000 (50 KB) | Z8600021 (talk | contribs) | ==Yolk sac and amniotic cavity volume graph== :Links: Coelomic Cavity Development | Placenta - Membranes |
You cannot overwrite this file.
File usage
The following page uses this file: