File:Somite boundary formation model 01.jpg

Original file (416 × 1,000 pixels, file size: 81 KB, MIME type: image/jpeg)
Somite Boundary Formation Model
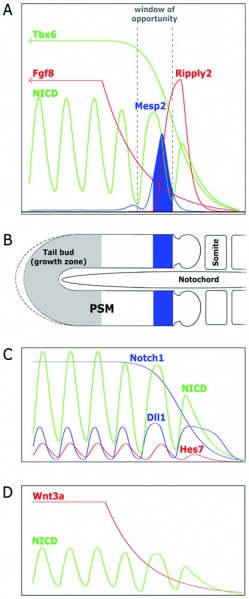
Relation between temporal evolution of gene expression and spatial pattern in somitogenesis. Panels A, C, and D show the time evolution of gene expressions in our model for one cell (not all drawn to scale). Panel B depicts a sketch of the PSM (anterior to the right) with formed somites, the growth zone, and a forming somitic cleft, in which the anterior boundary of Mesp2 expression marks the upcoming somite boundary.
(A) Mesp2 is induced by dynamic activated NOTCH (NICD) expression in concert with TBX6. The Mesp2 expression boundary moves to the right together with the WNT3A and FGF8 gradients that are generated by decay of their gene products after their expression has stopped outside the growth zone. At the same time, Mesp2 is repressed by FGF8 signaling and by RIPPLY2, which is induced by MESP2. By the growing PSM the temporal expression is mapped into a spatial pattern: in a moving ‘window of opportunity’ between activating TBX6 and repressive FGF8 expression, Mesp2 is induced when NICD is highly expressed, i.e. the NICD wave ‘moves’ into this window.
(C) NICD expression oscillates as a result of the reaction of NOTCH1 (static expression) with DLL1, which is dynamic and controlled by the negative feedback oscillator HES7.
(D) NICD forms a ‘wave’ because its oscillations are slowed down by interaction with the WNT3A gradient.
- Links: Somitogenesis
Reference
Tiedemann HB, Schneltzer E, Zeiser S, Hoesel B, Beckers J, Przemeck GK & de Angelis MH. (2012). From dynamic expression patterns to boundary formation in the presomitic mesoderm. PLoS Comput. Biol. , 8, e1002586. PMID: 22761566 DOI.
Citation: Tiedemann HB, Schneltzer E, Zeiser S, Hoesel B, Beckers J, et al. (2012) From Dynamic Expression Patterns to Boundary Formation in the Presomitic Mesoderm. PLoS Comput Biol 8(6): e1002586. doi:10.1371/journal.pcbi.1002586
Copyright
© 2012 Tiedemann et al. This is an open-access article distributed under the terms of the Creative Commons Attribution License, which permits unrestricted use, distribution, and reproduction in any medium, provided the original author and source are credited.
Figure 1. doi:10.1371/journal.pcbi.1002586.g001
File history
Click on a date/time to view the file as it appeared at that time.
| Date/Time | Thumbnail | Dimensions | User | Comment | |
|---|---|---|---|---|---|
| current | 17:50, 9 August 2012 |  | 416 × 1,000 (81 KB) | Z8600021 (talk | contribs) | ==Somite boundary formation model== Relation between temporal evolution of gene expression and spatial pattern in somitogenesis. Panels A, C, and D show the time evolution of gene expressions in our model for one cell (not all drawn to scale). Panel B |
You cannot overwrite this file.
File usage
There are no pages that use this file.