File:Limb 3D map of cell proliferation rates.jpg

Original file (1,000 × 794 pixels, file size: 242 KB, MIME type: image/jpeg)
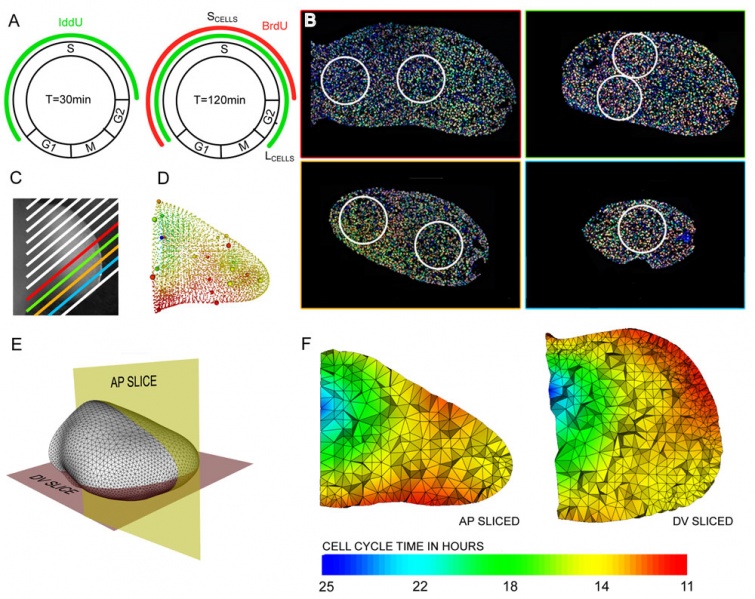
A quantitative 3D map of cell proliferation rates
(A) The four phases of the cell cycle: Gap 1 (G1), Synthesis (S-phase), Gap 2 (G2), and Mitosis (M phase). IddU was injected into the mouse and incorporated into the limb bud cells in S-phase (left-hand side, green bar). After time interval Ti a second injection is made, this time of BrdU, which again labels the cells in S-phase at that moment (right-hand side, red bar). At this point some of the IddU-labelled cells from the first injection (green) have left S-phase and are now in G2. These are the “Leaving cells,” or Lcells, and were counted to calculate Tc using equation (2). (B) 7 µm thick paraffin sections were imaged by confocal microscopy. For each of the 30 counting regions (white circles on sections, 215 µm diametre), the total number of cells is counted and also the number of Lcells (blue and green IddU-labelled cells, which display no red). (C) The positions of the 13 sections overlaid onto a photo of the same limb. (D) The calculated Tc values are assigned to the corresponding vertices on the 3D mesh (indicated by small coloured spheres) and are interpolated onto the remaining vertices. (E) Schematic of virtual sections anterio-posterior (AP) and dorso-ventral (DV). (F) Colors show the distribution of the Tc values in hours for the virtual sections indicated in (E). A core of low proliferation (proximal central) and areas of high proliferation (dorsal and ventral), as well as a ridge of high proliferation (anterior-distal) can be seen.
Original file name: Figure 3. Journal.pbio.1000420.g003.png
Reference
<pubmed>20644711</pubmed>| PMC2903592 | PLoS
Citation: Boehm B, Westerberg H, Lesnicar-Pucko G, Raja S, Rautschka M, et al. (2010) The Role of Spatially Controlled Cell Proliferation in Limb Bud Morphogenesis. PLoS Biol 8(7): e1000420. doi:10.1371/journal.pbio.1000420
Copyright: © 2010 Boehm et al. This is an open-access article distributed under the terms of the Creative Commons Attribution License, which permits unrestricted use, distribution, and reproduction in any medium, provided the original author and source are credited.
File history
Click on a date/time to view the file as it appeared at that time.
| Date/Time | Thumbnail | Dimensions | User | Comment | |
|---|---|---|---|---|---|
| current | 10:20, 23 March 2011 | | 1,000 × 794 (242 KB) | S8600021 (talk | contribs) | ==A quantitative 3D map of cell proliferation rates== (A) The four phases of the cell cycle: Gap 1 (G1), Synthesis (S-phase), Gap 2 (G2), and Mitosis (M phase). IddU was injected into the mouse and incorporated into the limb bud cells in S-phase (left-ha |
You cannot overwrite this file.
File usage
The following 2 pages use this file: