File:Human development timeline graph 01.jpg
From Embryology
Size of this preview: 800 × 600 pixels. Other resolution: 1,000 × 750 pixels.
Original file (1,000 × 750 pixels, file size: 141 KB, MIME type: image/jpeg)
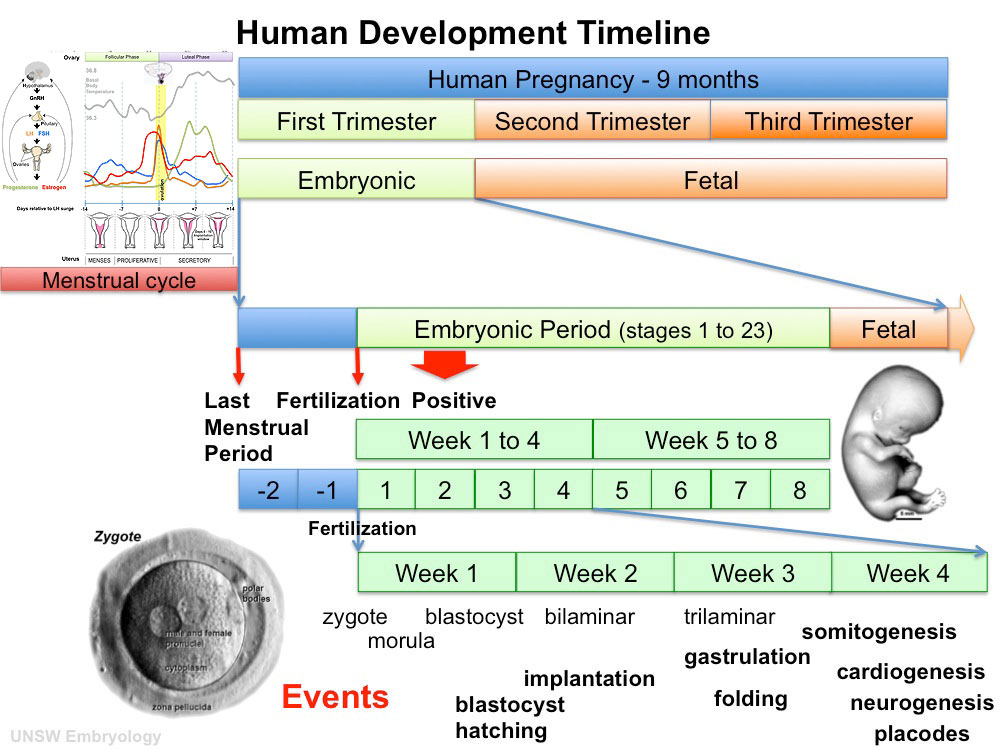
Human Development Timeline
This graph shows an overview of human development and details about embryonic development.
Start from the top of the figure and work your way down for more detail.
Note:
|
|
File history
Click on a date/time to view the file as it appeared at that time.
| Date/Time | Thumbnail | Dimensions | User | Comment | |
|---|---|---|---|---|---|
| current | 13:31, 20 May 2011 | | 1,000 × 750 (141 KB) | S8600021 (talk | contribs) | |
| 21:14, 10 April 2011 |  | 1,000 × 750 (134 KB) | S8600021 (talk | contribs) | ||
| 18:18, 10 April 2011 |  | 800 × 600 (98 KB) | S8600021 (talk | contribs) |
You cannot overwrite this file.
File usage
The following 12 pages use this file:
- ANAT2341 Lab 1 2013
- BGDA Practical - Fertilization to Implantation
- BGDA Practical 3 - Week 3 Summary
- Fetal ECHO Meeting 2012
- Foundations Lecture - Introduction to Human Development
- Foundations Practical - Week 1 to 8
- Human Development Timeline Movie
- Lecture - Week 3 Development
- Pre-Medicine Program - Embryology
- RPAH Cardiac Embryology 2014
- Timeline human development
- Talk:Flash Movies