File:Drosophila gastrulation.jpg
Drosophila_gastrulation.jpg (714 × 577 pixels, file size: 163 KB, MIME type: image/jpeg)
Drosophila Gastrulation
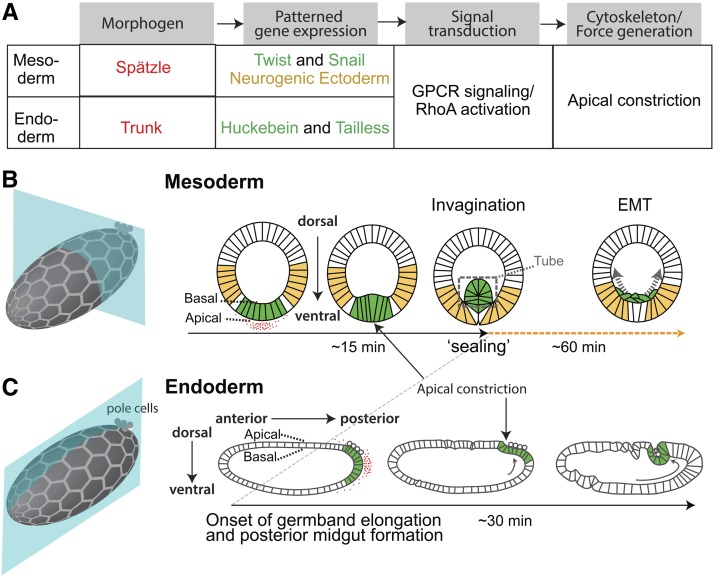
A Flow chart showing the regulation of cell shape changes that accompany Drosophila gastrulation. Coloured text matches the colours in (B and C).
B Cartoon showing mesoderm invagination in Drosophila. Hexagonal mesh illustrates plane of epithelium, but cell size is not to scale. Red shows pattern of active Spätzle. Green illustrates presumptive mesoderm cells, which express Twist and Snail in response to high levels of Dorsal. Yellow cells show region of ectoderm, which is specified by low levels of Dorsal.
C Cartoon showing posterior endoderm invagination. Hexagonal mesh illustrates plane of epithelium, but cell size is not to scale. Red shows distribution of the signaling ligand Trunk. Green illustrates presumptive endoderm cells expressing Huckebein and Tailless. Arrow shows the direction of germband elongation.
- Links: gastrulation | Drosophila | morphodynamics
Reference
Martin AC. (2020). The Physical Mechanisms of Drosophila Gastrulation: Mesoderm and Endoderm Invagination. Genetics , 214, 543-560. PMID: 32132154 DOI.
Copyright
© 2020 Martin
This is an open-access article distributed under the terms of the Creative Commons Attribution 4.0 International License (http://creativecommons.org/licenses/by/4.0/), which permits unrestricted use, distribution, and reproduction in any medium, provided the original work is properly cited.
Cite this page: Hill, M.A. (2024, April 23) Embryology Drosophila gastrulation.jpg. Retrieved from https://embryology.med.unsw.edu.au/embryology/index.php/File:Drosophila_gastrulation.jpg
- © Dr Mark Hill 2024, UNSW Embryology ISBN: 978 0 7334 2609 4 - UNSW CRICOS Provider Code No. 00098G
File history
Click on a date/time to view the file as it appeared at that time.
| Date/Time | Thumbnail | Dimensions | User | Comment | |
|---|---|---|---|---|---|
| current | 11:10, 30 April 2020 |  | 714 × 577 (163 KB) | Z8600021 (talk | contribs) | ==Drosophila Gastrulation== (A) Flow chart showing the regulation of cell shape changes that accompany Drosophila gastrulation. Colored text matches the colors in (B and C). (B) Cartoon showing mesoderm invagination in Drosophila. Hexagonal mesh illustrates plane of epithelium, but cell size is not to scale. Red shows pattern of active Spätzle. Green illustrates presumptive mesoderm cells, which express Twist and Snail in response to high levels of Dorsal. Yellow cells show region of ectoder... |
You cannot overwrite this file.
File usage
The following 3 pages use this file:
