File:Development of mouse embryo in early stages.png
Original file (1,910 × 2,240 pixels, file size: 3.3 MB, MIME type: image/png)
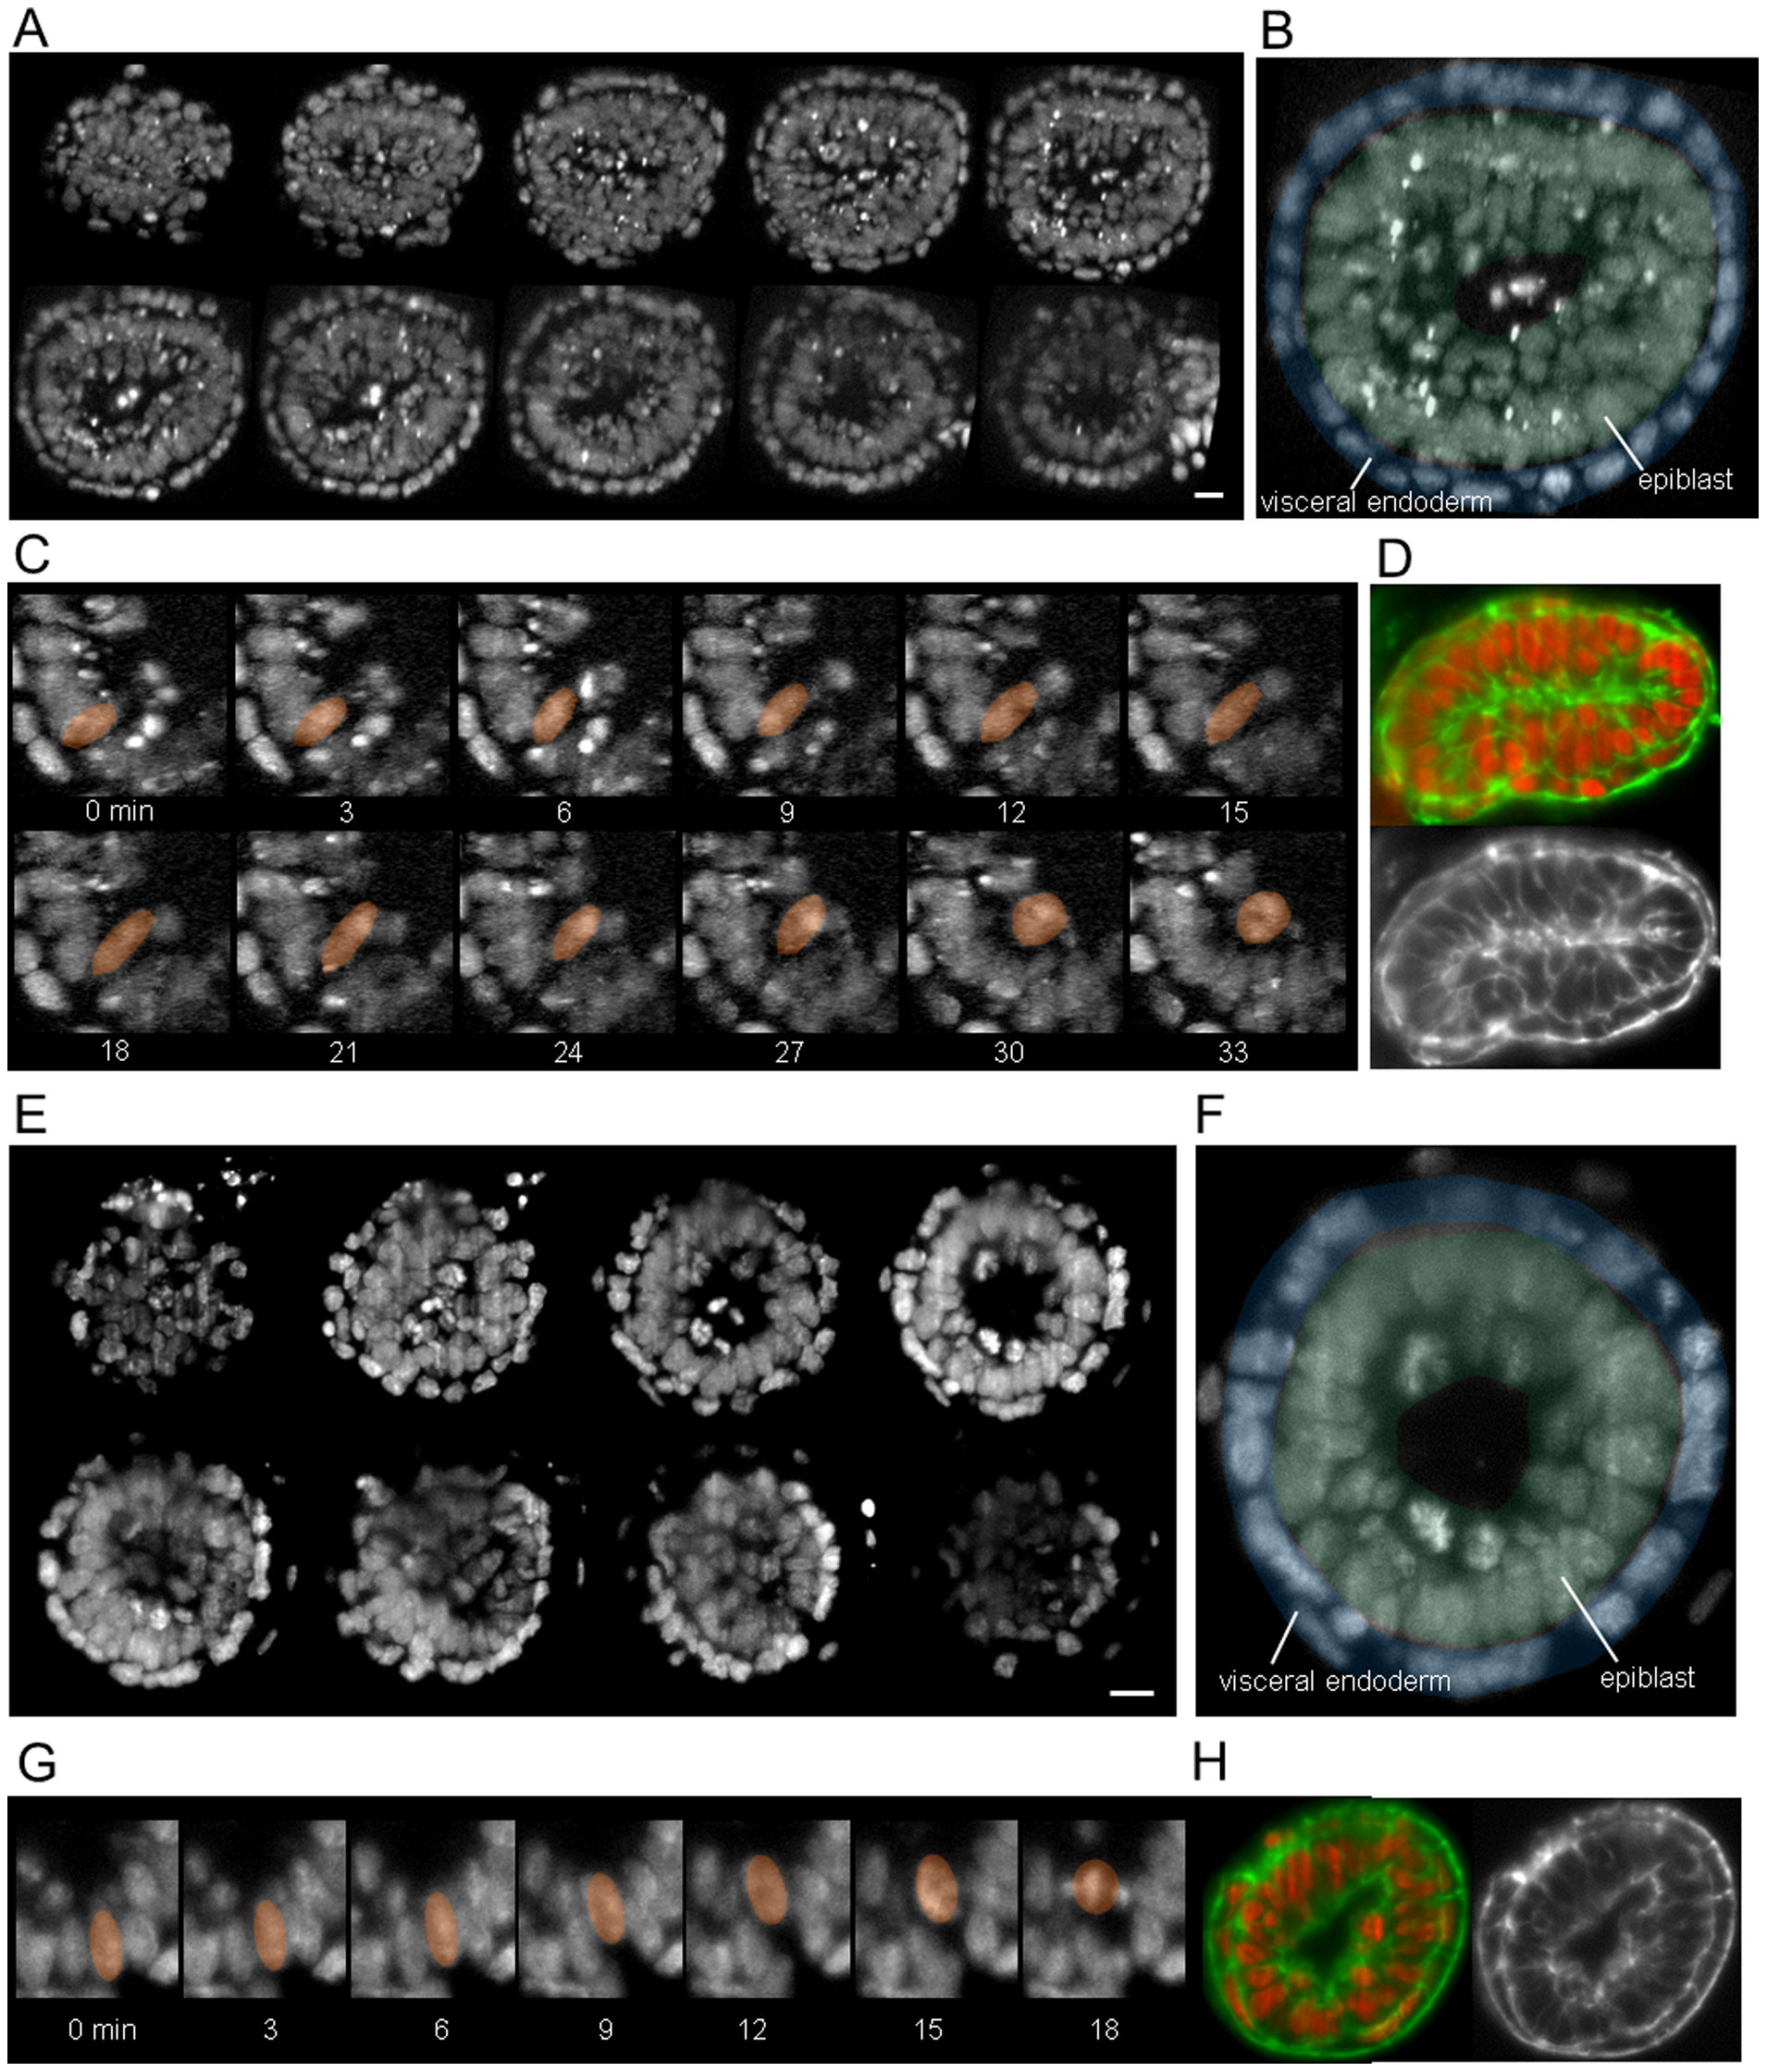
Imaging of mouse embryos at E5.5 and E6
(A and E) Each image represents the maximum intensity projection of a 13-µm thick section. Scale bar = 20 µm. (B and F) Annotated sections are 65 (B) and 40 (E) µm from the distal end of the embryo. Blue and green areas indicate visceral endoderm and epiblast, respectively. (C and G) INM and INM-like movement in the epiblast. The colored nucleus exhibits apical migration. (D and H) Image of sections stained with Alexa Fluor 546 phalloidin (membrane) and DRAQ5 (nucleus).
z5014803
http://dx.doi.org/10.1371/journal.pone.0064506.g003
References
<pubmed>23861733</pubmed>
Copyright
© 2013 Ichikawa et al. This is an open-access article distributed under the terms of the Creative Commons Attribution License, which permits unrestricted use, distribution, and reproduction in any medium, provided the original author and source are credited.
File history
Click on a date/time to view the file as it appeared at that time.
| Date/Time | Thumbnail | Dimensions | User | Comment | |
|---|---|---|---|---|---|
| current | 21:32, 18 August 2016 | | 1,910 × 2,240 (3.3 MB) | Z5014803 (talk | contribs) | (A and E) Each image represents the maximum intensity projection of a 13-µm thick section. Scale bar = 20 µm. (B and F) Annotated sections are 65 (B) and 40 (E) µm from the distal end of the embryo. Blue and green areas indicate visceral endode... |
You cannot overwrite this file.
File usage
The following page uses this file: