File:Chicken neural induction markers.jpg

Original file (1,020 × 800 pixels, file size: 137 KB, MIME type: image/jpeg)
Hensen's node Timecourse of Neural Induction Markers
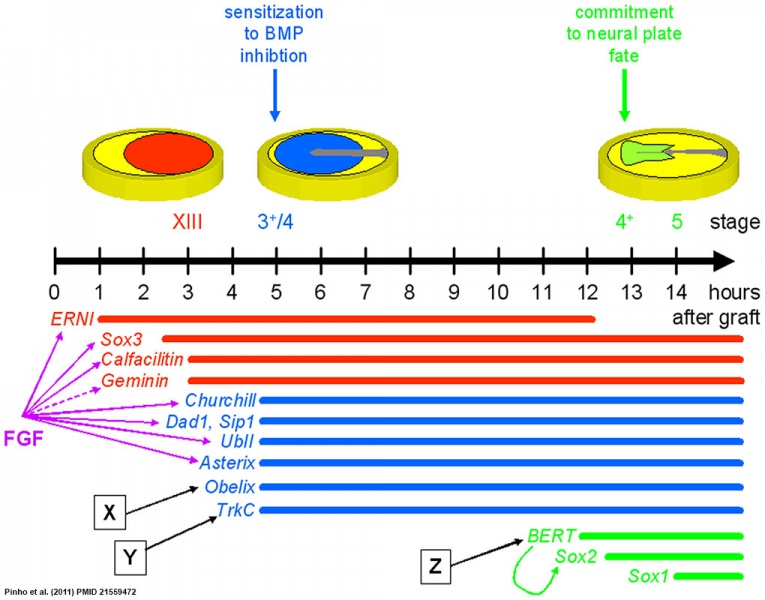
Temporal hierarchy of deployment of 13 early neural markers.
The colored lines at the bottom of the figure represent the period of expression of these genes, in relation to the time at which they are induced following a graft of Hensen's node into the area opaca (in hours on the scale above) and in relation to the stage of normal embryos at which they are expressed (stage shown above the time line). The diagrams above these stages schematize the domains of expression.
The genes fall into three “epochs”:
- Red - those induced by a node within 3 hours start to be expressed in normal embryos before streak formation.
- Blue - those induced by a node in 4–5 hours begin their expression at the mid- to late-primitive streak stage.
- Green - those induced by a node at 12–13 hours do not begin their expression until the end of gastrulation, in the forming neural plate.
Reference
<pubmed>21559472</pubmed>| PLoS ONE
Copyright
© 2011 Pinho et al. This is an open-access article distributed under the terms of the Creative Commons Attribution License, which permits unrestricted use, distribution, and reproduction in any medium, provided the original author and source are credited.
Pinho S, Simonsson PR, Trevers KE, Stower MJ, Sherlock WT, et al. (2011) Distinct Steps of Neural Induction Revealed by Asterix, Obelix and TrkC, Genes Induced by Different Signals from the Organizer. PLoS ONE 6(4): e19157.
Figure 11. doi:10.1371/journal.pone.0019157.g011
Journal.pone.0019157.g011.jpg
File history
Click on a date/time to view the file as it appeared at that time.
| Date/Time | Thumbnail | Dimensions | User | Comment | |
|---|---|---|---|---|---|
| current | 05:07, 9 December 2013 |  | 1,020 × 800 (137 KB) | Z8600021 (talk | contribs) | ==Hensen's node Timecourse of Neural Induction Markers== Temporal hierarchy of deployment of 13 early neural markers. The colored lines at the bottom of the figure represent the period of expression of these genes, in relation to the time at which the... |
You cannot overwrite this file.
File usage
The following page uses this file: