File:Chicken limb gene expression 01.jpg
Original file (1,200 × 758 pixels, file size: 85 KB, MIME type: image/jpeg)
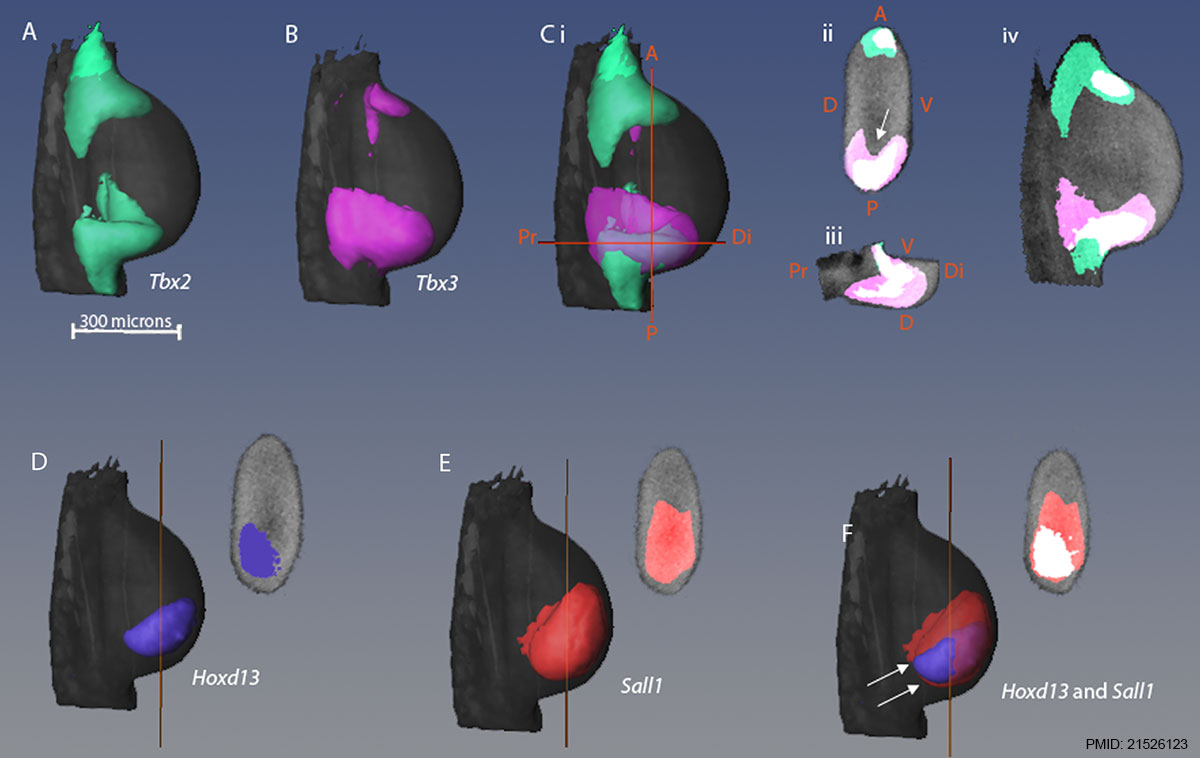
Comparison of 3D gene expression patterns in stage 21 wing bud
(A–C) Dorsal views of 3D isosurface representations of a stage 21 wing bud with expression patterns of Tbx2 (A), Tbx3 (B) and both Tbx2 and Tbx3 shown together (C). Orange lines represent the positions of the sections shown in Cii and Ciii. (Cii–Civ) 2D virtual sections of limb bud showing Tbx2 and Tbx3 expression where overlapping regions are shown in white, Tbx2 alone in green and Tbx3 alone in pink. (Civ) Sagittal section through middle of limb.
A = anterior, P = posterior, D = dorsal, V = ventral, Pr = proximal, Di = distal.
(D–F) Dorsal views of same wing bud showing expression patterns of Hoxd13 (D), Sall1 (E), and Hoxd13 and Sall1 together with the overlapping region in white (F). Sections are shown in the same orientation as Cii, and the orange lines indicate the section position along the proximo-distal axis.
Reference
<pubmed>21526123</pubmed>| PLoS One.
Copyright
© 2011 Fisher et al. This is an open-access article distributed under the terms of the Creative Commons Attribution License, which permits unrestricted use, distribution, and reproduction in any medium, provided the original author and source are credited.
Figure 1. Journal.pone.0018661.g001.jpg doi:10.1371/journal.pone.0018661.g001
File history
Click on a date/time to view the file as it appeared at that time.
| Date/Time | Thumbnail | Dimensions | User | Comment | |
|---|---|---|---|---|---|
| current | 16:27, 13 February 2014 | | 1,200 × 758 (85 KB) | Z8600021 (talk | contribs) | ==Comparison of 3D gene expression patterns in stage 21 wing bud== (A–C) Dorsal views of 3D isosurface representations of a stage 21 wing bud with expression patterns of Tbx2 (A), Tbx3 (B) and both Tbx2 and Tbx3 shown together (C). Orange lines rep... |
You cannot overwrite this file.
File usage
There are no pages that use this file.