File:Acute otitis media infection age graph01.png

Original file (1,280 × 791 pixels, file size: 77 KB, MIME type: image/png)
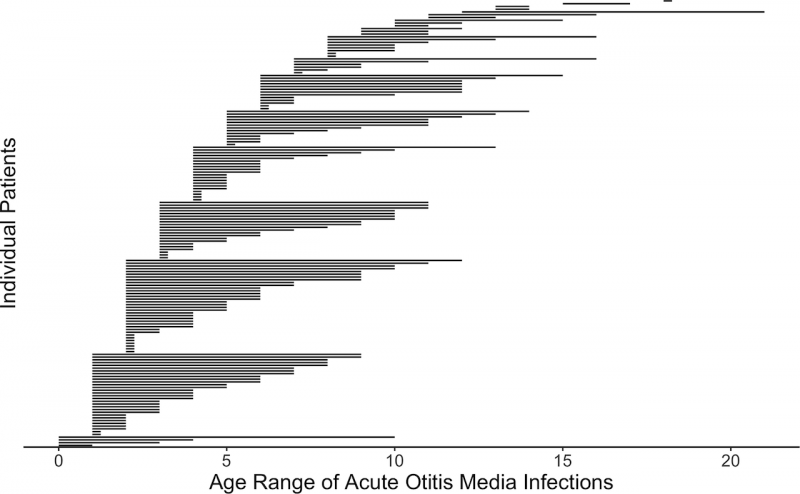
Age range of acute otitis media infections
Each line represents an individual patient. N = 162 represents all patients who had at least one AOM infection. Scale is years.
- Links: hearing test | hearing | middle ear
Reference
Norowitz HL, Morello T, Kupfer HM, Kohlhoff SA & Smith-Norowitz TA. (2019). Association between otitis media infection and failed hearing screenings in children. PLoS ONE , 14, e0212777. PMID: 30794686 DOI.
Copyright
© 2019 Norowitz et al. This is an open access article distributed under the terms of the Creative Commons Attribution License, which permits unrestricted use, distribution, and reproduction in any medium, provided the original author and source are credited.
Fig 3. https://doi.org/10.1371/journal.pone.0212777.g003
Cite this page: Hill, M.A. (2024, April 23) Embryology Acute otitis media infection age graph01.png. Retrieved from https://embryology.med.unsw.edu.au/embryology/index.php/File:Acute_otitis_media_infection_age_graph01.png
- © Dr Mark Hill 2024, UNSW Embryology ISBN: 978 0 7334 2609 4 - UNSW CRICOS Provider Code No. 00098G
File history
Click on a date/time to view the file as it appeared at that time.
| Date/Time | Thumbnail | Dimensions | User | Comment | |
|---|---|---|---|---|---|
| current | 09:55, 12 April 2019 |  | 1,280 × 791 (77 KB) | Z8600021 (talk | contribs) | Fig 3. Age range of AOM infections. Each line represents an individual patient. N = 162 represents all patients who had at least one AOM infection. https://doi.org/10.1371/journal.pone.0212777.g003 acute otitis media (AOM) infection Copyright: © 201... |
You cannot overwrite this file.
File usage
The following 2 pages use this file: