File:Abnormal AusData81-92Graph.png
Abnormal_AusData81-92Graph.png (509 × 320 pixels, file size: 7 KB, MIME type: image/png)
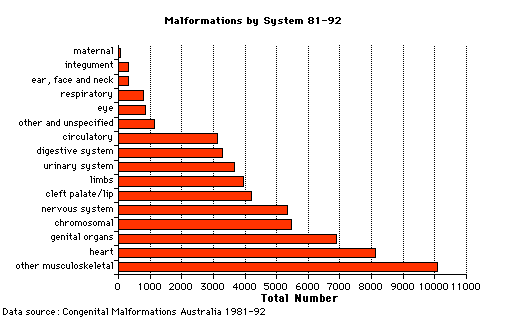
Abnormal Development - Australia (1981-1992)
Graph shows the percentage of developmental abnormalities by categories of all notifiable birth defects in Australia.
Data groupings and classification as Major or Minor Abnormalities are based on that used by the Australian Institute of Health and Welfare National Perinatal Statistics Unit, UNSW and published in Congenital Malformations Australia 1981-92.
For individual systems, data shown as a % of all Major Abnormalities based upon published statistics using the same groupings as CMA 81-92. Please note that some congenital diseases involve more than one system.
- Links: Australian Statistics | Abnormal Development | Reports
Reference
Lancaster P & Pedisich E 1995. Congenital malformations Australia 1981-1992. Birth defects series no. 1. Cat. no. AIHW 213. Canberra: AIHW | NPESU | ISSN 13218352.
(Data source)
Cite this page: Hill, M.A. (2024, April 19) Embryology Abnormal AusData81-92Graph.png. Retrieved from https://embryology.med.unsw.edu.au/embryology/index.php/File:Abnormal_AusData81-92Graph.png
- © Dr Mark Hill 2024, UNSW Embryology ISBN: 978 0 7334 2609 4 - UNSW CRICOS Provider Code No. 00098G
File history
Click on a date/time to view the file as it appeared at that time.
| Date/Time | Thumbnail | Dimensions | User | Comment | |
|---|---|---|---|---|---|
| current | 14:16, 12 August 2009 | | 509 × 320 (7 KB) | MarkHill (talk | contribs) | Pie diagram shows the percentage of developmental abnormalities by categories of all notifiable birth defects in Australia. Data groupings and classification as Major or Minor Abnormalities are based on that used by the Australian Institute of Health and |
You cannot overwrite this file.
File usage
The following 11 pages use this file:
- 2010 BGD Practical 12 - Abnormalities
- 2010 Lecture 1
- 2011 Lab 12 - Abnormalities
- ANAT2341 Lab 12 - Abnormalities
- Abnormal Development - Unknown
- BGDA Practical 12 - Abnormalities
- Human Abnormal Development
- Lecture - 2011 Course Introduction
- Lecture - 2012 Course Introduction
- Lecture - 2013 Course Introduction
- Renal System - Abnormalities