File:1532-429X-12-14-3.jpg
1532-429X-12-14-3.jpg (600 × 453 pixels, file size: 44 KB, MIME type: image/jpeg)
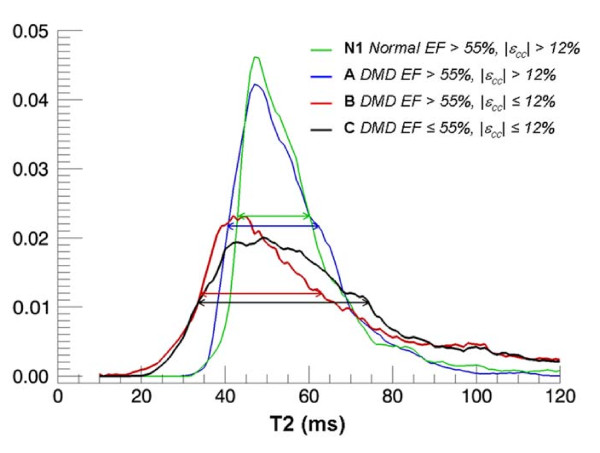
T2 histograms.
Examples of normalized (i.e. area under curve = 1) T2 histograms of DMD (Group A, B and C) and Normal control (N1) subjects show that DMD patients with normal EF but impaired εcc has higher heterogeneity in T2 compared to other groups.
http://www.ncbi.nlm.nih.gov/pmc/articles/PMC2846924/
This is an Open Access article distributed under the terms of the Creative Commons Attribution License (http://creativecommons.org/licenses/by/2.0), which permits unrestricted use, distribution, and reproduction in any medium, provided the original work is properly cited.
1532-429X-12-14-3.jpg
File history
Click on a date/time to view the file as it appeared at that time.
| Date/Time | Thumbnail | Dimensions | User | Comment | |
|---|---|---|---|---|---|
| current | 14:02, 11 August 2011 | | 600 × 453 (44 KB) | Z3332629 (talk | contribs) | T2 histograms. Examples of normalized (i.e. area under curve = 1) T2 histograms of DMD (Group A, B and C) and Normal control (N1) subjects show that DMD patients with normal EF but impaired εcc has higher heterogeneity in T2 compared to other groups. |
You cannot overwrite this file.
File usage
The following file is a duplicate of this file (more details):
The following page uses this file: