File:USA births fertility 2010.jpg: Difference between revisions
From Embryology
No edit summary |
|||
| Line 2: | Line 2: | ||
'''Recent Trends in Births and Fertility Rates Through 2010'''<ref>Sutton PD, Hamilton BE, Mathews TJ. '''Recent Trends in Births and Fertility Rates Through 2010''' NCHS data brief MD: National Center for Health Statistics. 2011.[http://www.cdc.gov/nchs/data/hestat/births_fertility_2010/births_fertility_2010.htm online report] | [http://www.cdc.gov/nchs/data/hestat/births_fertility_2010/births_fertility_2010.pdf PDF] </ref> [http://www.cdc.gov/nchs/data/hestat/births_fertility_2010/births_fertility_2010.htm online report] | [http://www.cdc.gov/nchs/data/hestat/births_fertility_2010/births_fertility_2010.pdf PDF] | '''Recent Trends in Births and Fertility Rates Through 2010'''<ref>Sutton PD, Hamilton BE, Mathews TJ. '''Recent Trends in Births and Fertility Rates Through 2010''' NCHS data brief MD: National Center for Health Statistics. 2011.[http://www.cdc.gov/nchs/data/hestat/births_fertility_2010/births_fertility_2010.htm online report] | [http://www.cdc.gov/nchs/data/hestat/births_fertility_2010/births_fertility_2010.pdf PDF] </ref> [http://www.cdc.gov/nchs/data/hestat/births_fertility_2010/births_fertility_2010.htm online report] | [http://www.cdc.gov/nchs/data/hestat/births_fertility_2010/births_fertility_2010.pdf PDF] | ||
* The broad-based decline in births and fertility rates from 2007 through 2009 is now well-documented. An earlier NCHS Health E-Stat showed the overall birth count and fertility rate continuing to decline through the first 6 months of 2010. This report updates and extends the trend through December 2010. | |||
* The provisional count of births in the United States for 2010 (12-month period ending December 2010) was 4,007,000. This count was 3 percent less than the number of births in 2009 (4,131,019) and 7 percent less than the all-time high of 4,316,233 births in 2007. | |||
* The provisional fertility rate for 2010 was 64.7 births per 1,000 women aged 15–44. This was 3 percent less than the 2009 preliminary rate of 66.7 and 7 percent less than the 17-year high of 69.5 in 2007 | |||
===Reference=== | ===Reference=== | ||
Revision as of 11:35, 20 June 2011
USA Births and Fertility 2010
Recent Trends in Births and Fertility Rates Through 2010[1] online report | PDF
- The broad-based decline in births and fertility rates from 2007 through 2009 is now well-documented. An earlier NCHS Health E-Stat showed the overall birth count and fertility rate continuing to decline through the first 6 months of 2010. This report updates and extends the trend through December 2010.
- The provisional count of births in the United States for 2010 (12-month period ending December 2010) was 4,007,000. This count was 3 percent less than the number of births in 2009 (4,131,019) and 7 percent less than the all-time high of 4,316,233 births in 2007.
- The provisional fertility rate for 2010 was 64.7 births per 1,000 women aged 15–44. This was 3 percent less than the 2009 preliminary rate of 66.7 and 7 percent less than the 17-year high of 69.5 in 2007
Reference
<reference/>
- ↑ Sutton PD, Hamilton BE, Mathews TJ. Recent Trends in Births and Fertility Rates Through 2010 NCHS data brief MD: National Center for Health Statistics. 2011.online report | PDF
File history
Click on a date/time to view the file as it appeared at that time.
| Date/Time | Thumbnail | Dimensions | User | Comment | |
|---|---|---|---|---|---|
| current | 11:00, 20 June 2011 | 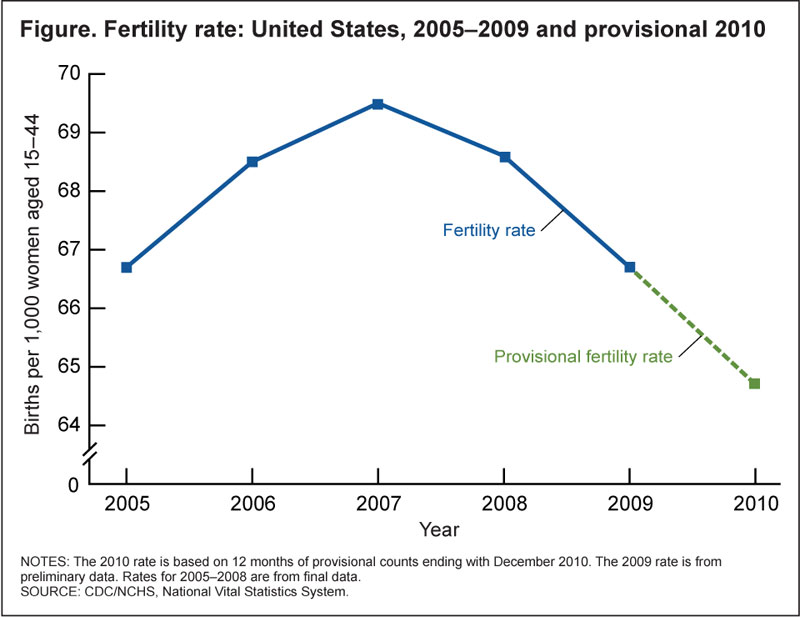 | 800 × 617 (54 KB) | MarkHill (talk | contribs) | ==USA Births and Fertility 2010== '''Recent Trends in Births and Fertility Rates Through 2010'''<ref>Sutton PD, Hamilton BE, Mathews TJ. '''Recent Trends in Births and Fertility Rates Through 2010''' NCHS data brief MD: National Center for Health Statist |
You cannot overwrite this file.
File usage
The following 2 pages use this file: