File:Teen pregnancy USA.png: Difference between revisions
From Embryology
No edit summary |
No edit summary |
||
| Line 1: | Line 1: | ||
==Teen pregnancy USA== | |||
Birth Rates* for Teens Aged 15 -19 Years, by Age Group United States, 1985 - 2007† | Birth Rates* for Teens Aged 15 -19 Years, by Age Group United States, 1985 - 2007† | ||
| Line 5: | Line 7: | ||
† Birth statistics are based on birth certificates filed in state vital statistics offices and reported to the National Center for Health Statistics through the National Vital Statistics System. | † Birth statistics are based on birth certificates filed in state vital statistics offices and reported to the National Center for Health Statistics through the National Vital Statistics System. | ||
Birth rate for teens aged 15 -19 years | |||
* from 1986 increasing 23% overall to a peak in 1991 | |||
* then decreasing 34% by 2005 | |||
* increased 5% from 2005 to 2007 | |||
* most of this increase occurred in 2006 | |||
Increases in birth rates from 2005 to 2007 for teens aged 18 - 19 years were slightly larger than the increases for teens aged 15 -17 years. | |||
===Reference=== | |||
Hamilton BE, Martin JA, Ventura SJ. Births: preliminary data for 2007. Natl Vital Stat Rep 2009;57(12). Available at http://www.cdc.gov/nchs/data/nvsr/nvsr57/nvsr57_12.pdf. | |||
http://www.cdc.gov/mmwr/preview/mmwrhtml/mm5812a5.htm?s_cid=mm5812a5_e | http://www.cdc.gov/mmwr/preview/mmwrhtml/mm5812a5.htm?s_cid=mm5812a5_e | ||
Revision as of 12:45, 2 June 2011
Teen pregnancy USA
Birth Rates* for Teens Aged 15 -19 Years, by Age Group United States, 1985 - 2007†
- Per 1,000 women for specified age group.
† Birth statistics are based on birth certificates filed in state vital statistics offices and reported to the National Center for Health Statistics through the National Vital Statistics System.
Birth rate for teens aged 15 -19 years
- from 1986 increasing 23% overall to a peak in 1991
- then decreasing 34% by 2005
- increased 5% from 2005 to 2007
- most of this increase occurred in 2006
Increases in birth rates from 2005 to 2007 for teens aged 18 - 19 years were slightly larger than the increases for teens aged 15 -17 years.
Reference
Hamilton BE, Martin JA, Ventura SJ. Births: preliminary data for 2007. Natl Vital Stat Rep 2009;57(12). Available at http://www.cdc.gov/nchs/data/nvsr/nvsr57/nvsr57_12.pdf.
http://www.cdc.gov/mmwr/preview/mmwrhtml/mm5812a5.htm?s_cid=mm5812a5_e
File history
Click on a date/time to view the file as it appeared at that time.
| Date/Time | Thumbnail | Dimensions | User | Comment | |
|---|---|---|---|---|---|
| current | 11:12, 26 January 2010 | 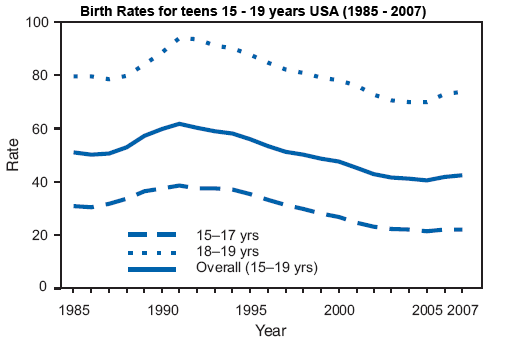 | 532 × 339 (7 KB) | S8600021 (talk | contribs) | Birth Rates* for Teens Aged 15 -19 Years, by Age Group United States, 1985 - 2007† * Per 1,000 women for specified age group. † Birth statistics are based on birth certificates filed in state vital statistics offices and reported to the National Ce |
You cannot overwrite this file.
File usage
The following 3 pages use this file: