Postnatal - Growth Charts
| Embryology - 16 Apr 2024 |
|---|
| Google Translate - select your language from the list shown below (this will open a new external page) |
|
العربية | català | 中文 | 中國傳統的 | français | Deutsche | עִברִית | हिंदी | bahasa Indonesia | italiano | 日本語 | 한국어 | မြန်မာ | Pilipino | Polskie | português | ਪੰਜਾਬੀ ਦੇ | Română | русский | Español | Swahili | Svensk | ไทย | Türkçe | اردو | ייִדיש | Tiếng Việt These external translations are automated and may not be accurate. (More? About Translations) |

Introduction
Part of the normal ongoing monitoring of the newborn infant development growth charts is the simple measurement of weight, length, head circumference, height and simple motor skills compared to large data sets of clinically normal infants. The original standards differed between countries and the time when the control data was collected (some based on data from 1970s or earlier). This has recently changed with the release of WHO international child growth standards using entirely new data sets. New international WHO Child Growth Standards (2006)[1] for infants and young children released (27 Apr) by the World Health Organization (WHO) provide evidence and guidance for the first time about how every child in the world should grow.
- "The new standards prove that differences in children's growth to age five are more influenced by nutrition, feeding practices, environment, and healthcare than genetics or ethnicity."
Earlier growth charts had been prepared independently for children of different countries and nationalities (see External Links) using large numbers of clinically normal children.
In Australia, following advice from National Health and Medical Research Council (NHMRC), the Australian Department of Health has determined that percentile charts from the U.S. National Centre for Health Statistics be used for Australian children (this may be updated to the new WHO standard). The percentiles on these charts are generally similar to the previous NHMRC Charts (1980) except that, above the age of 8 years, American children tend to be taller and heavier, this becoming more marked in the teenage years.
| Postnatal Links: birth | neonatal | neonatal diagnosis | milk | Nutrition | growth charts | Disease School Exclusion | vaccination | puberty | genital |
Some Recent Findings
|
| More recent papers |
|---|
 This table allows an automated computer search of the external PubMed database using the listed "Search term" text link.
More? References | Discussion Page | Journal Searches | 2019 References | 2020 References Search term: Postnatal Growth Charts | Growth Charts | Child Growth Standards |
| Older papers |
|---|
| These papers originally appeared in the Some Recent Findings table, but as that list grew in length have now been shuffled down to this collapsible table.
See also the Discussion Page for other references listed by year and References on this current page.
|
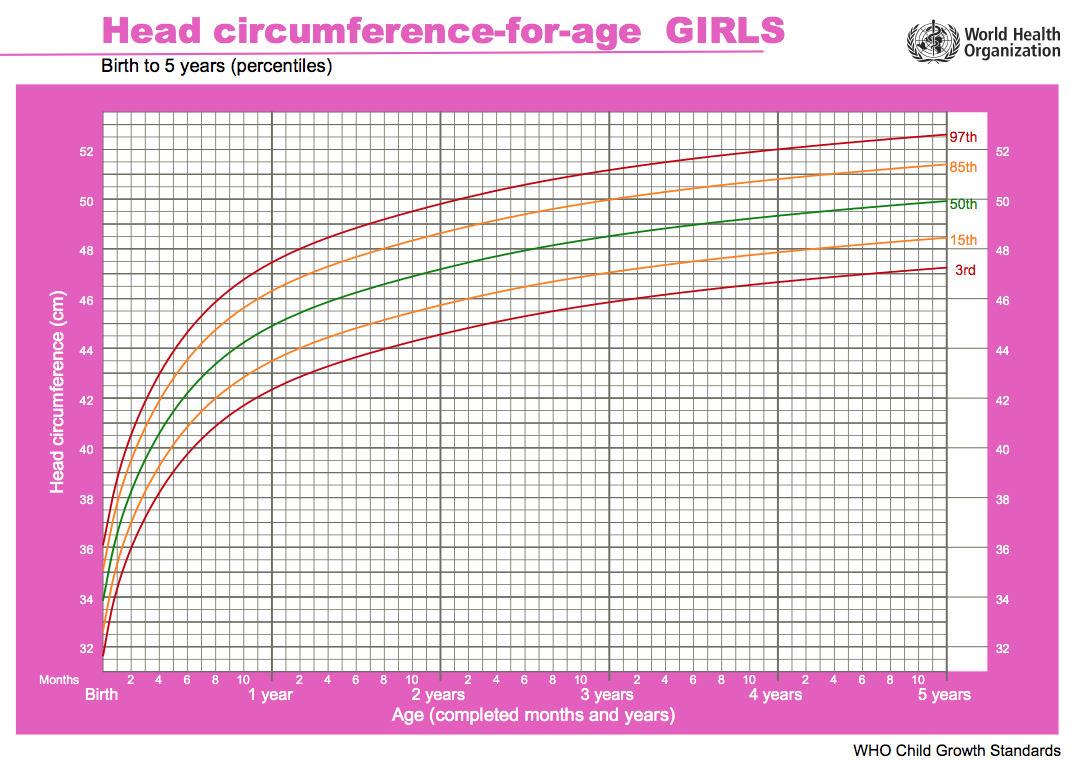
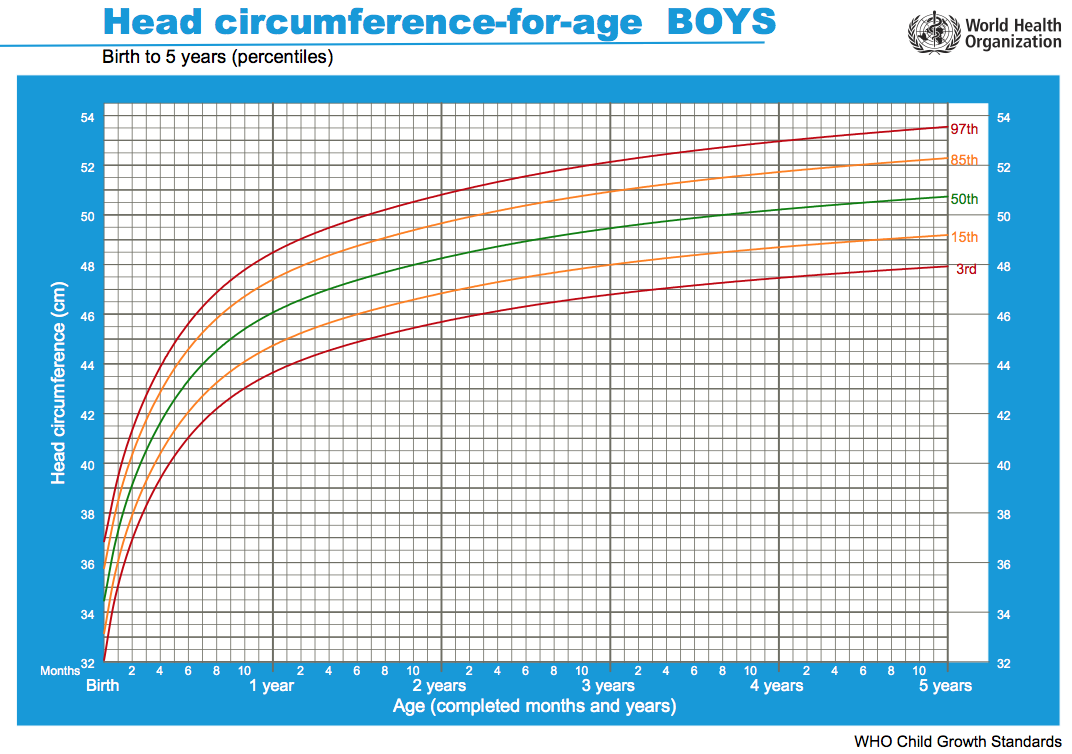
WHO Child Growth Standards
| Girls | Boys |
|---|---|

|

|
| Girls length birth to 2 years | Boys length birth to 2 years |

|

|
| Chart PDF | WHO - Girls | Chart PDF | WHO - Boys |
Head growth and corresponding charts differ slightly for girls and boys. Given as head circumference-for-age Birth to: 13 weeks, 2 years, 5 years.
Until page is updated please use the external links to the WHO resources listed below. Standards are available for download as PDF documents in either English, French and Spanish (and other languages).
Main introduction page WHO Child Growth Standards, data is available as Charts, tables and Simplified Field tables. (The WHO Child Growth Standards English documents link page)
Links to the first set of the WHO child growth standards (0 - 60 months):
- Length/height-for-age
- Weight-for-age
- Weight-for-length
- Weight-for-height
- Body mass index-for-age (BMI-for-age)
- Motor development milestones
Study data set: "WHO Multicentre Growth Reference Study (MGRS) was undertaken between 1997 and 2003 to generate new growth curves for assessing the growth and development of infants and young children around the world. The MGRS collected primary growth data and related information from approximately 8500 children from widely different ethnic backgrounds and cultural settings (Brazil, Ghana, India, Norway, Oman and the USA)."
- Links: ABC (Australia) News Item 28Apr06 | Nature News Item 11Aug04
UK-WHO Growth Charts
These UK growth charts are based upon the WHO charts, an associated paper describes "How to Use".[5]
The charts include a useful calculator of adult height from a child's current height, that can also be used for normal growth estimates.[10]
- UK WHO Growth Charts: 0-4 Years - Boys | 0-4 Years - Girls | NICM Boys | NICM Girls
- Links: UK WHO Growth Charts
Clinical Growth Measurements (USA)

|

|
| Girls length birth to 3 years | Boys length birth to 3 years |
- Infants (birth to 24 months) must be measured for length, and the sex appropriate length-for-age or weight-for-length charts for infants from birth to 36 months must be used to plot the measurements.
- At age 24 months and older, if children can stand unassisted and follow directions, stature should be measured and plotted on the stature-for-age chart for older children (2 to 20 years).
- BMI-for-age charts are recommended to assess weight in relation to stature for older children (2 to 20 years). The weight-for-stature charts are available as an alternative to accommodate children ages 2-5 years who are not evaluated beyond the preschool years. However, all health care providers should consider using the BMI-for-age charts to be consistent with current recommendations.
- Note- Body Mass Index (BMI), an evaluation of a person's weight status in relation to height, is the most commonly used approach to determine if adults are overweight or obese, and is now the recommended measure for assessing overweight in children.
Some text extracted from United States Clinical Growth Charts
Growth Charts
This link is to local PDF document of the 2001 CDC Growth charts. CDC Growth Charts - United States.pdf (16 pages 300 kb)
Data includes:
- Weight-for-age percentiles Boys, birth to 36 months, Girls, birth to 36 months, Boys, 2 to 20 years, Girls, 2 to 20 years
- Length-for-age percentiles Boys, birth to 36 months, Girls, birth to 36 months
- Stature-for-age percentiles Boys, 2 to 20 years, Girls, 2 to 20 years
- Head circumference-for-age percentiles Boys, birth to 36 months, Girls, birth to 36 months
- Weight-for-length percentiles, Boys, birth to 36 months, Girls, birth to 36 months
- Weight-for-stature percentiles, Boys, Girls
- Body mass index-for-age percentiles Boys, 2 to 20 years Girls, 2 to 20 years
Chinese Growth Charts
Historic data is also available for ethnic Chinese girls and boys in Hong Kong from the early 1960s.PubmedParser error: Pubmed did not return article data, please check the PMID or try again later. (PMID: 114185528) Environmental and nutritional factors may have altered these values over the last 40 years and more recent 2009 data is now available for height and weight[11] and body mass index.[12]
- "Comparison with the new WHO growth charts and 2000 CDC growth charts for the United States, the results showed that there was some big difference in weight and height among the three growth charts. For boys under 15 years of age and girls under 13 years of age, the China curves are slightly higher than WHO and CDC curves, but after those ages, the China curves fall behind and the difference became larger as age progresses. At the age of 18 years, the Chinese children are 3.5 cm shorter in boys and 2.5 cm shorter in girls as compared with the U. S. children. The difference in weights are very large for the school children, especially in girls. The weight of Chinese boys was 5.9 kg less than that of the U. S. boys at 18 years, and the difference was much bigger in girls, the weight of U.S. girls between 8 to 18 years was 4.1-20.5 kg more than that of Chinese girls at the same age range."[11]
Newborn Head Circumference

Neural Exam - Newborn head circumference
Movie showing how to accurately measure the newborn head circumference.
WHO - Breastfed Babies
The World Health Organization is revising pediatric growth charts to better reflect the growth of breast-fed babies. The revisions may take 5 years. In the meantime pediatricians should be aware that breastfed babies tend to gain 600-650 g less in their first year than formula-fed babies, with the most marked differences seen between ages 3 and 9 months, Kathryn C. Dewey, Ph.D., said at the annual meeting of the American Academy of Pediatrics. Pediatricians who are unaware of the differences tend to assume that breastfed babies lagging behind the growth charts are inadequately nourished. As a result, too many mothers are advised to begin supplementing earlier than necessary, she said. Existing growth charts for children aged 2-18 years were based on a nationally representative sample, but charts for those up to age 2 were based on a study since shown to have several limitations, said Dr. Dewey, associate director of the Program in International Nutrition and professor of nutrition at the University of California, Davis.
The sample was too homogeneous, growth measurements were made infrequently, and most babies were bottle-fed, she said.
Several studies have been conducted in the past several years to evaluate differences in growth patterns. One study that Dr. Dewey worked on--the Davis Area Research on Lactation, Infant Nutrition, and Growth study--found that breastfed babies generally weighed less in their first year because they voluntarily took in less milk than did formula-fed babies.
The breastfed babies met developmental milestones at similar ages to bottle-fed babies, they were just as active, and they were healthier. Bottle-fed babies had twice the incidence of diarrhea and 20% more cases of otitis media.
Most other studies found similar results, and this year WHO acted on its own 1994 report recommending that existing growth charts be revised. A multicountry study is underway, and in keeping with guidelines for infant care, the new chart will be based on babies breastfed for their first year, Dr. Dewey said.
Text extracted from Pediatric News 32(1): 1, 1998.
Growth Chart for Preterm Babies

Fetal-infant growth chart for preterm infants.[13] Improved 2003 version of the Babson and Benda graph based upon literature review and intrauterine data.
- Links: Birth - Preterm | UK Neonatal and Infant Close Monitoring charts- Boys | UK Neonatal and Infant Close Monitoring charts-Girls
Specialized Growth Charts
Trisomy 21 (Down Syndrome)
This paper describes an approach for generating subpopulation-specific growth charts meeting requirements for implementation into Electronic health record (EHR) systems, using as an example weights for children with Down syndrome. Gender-specific growth curves were generated from 2358 weight values obtained from 331 patients with Down syndrome from July 2001 until March 2005. The project generated printable curves and computable data tables formatted according to growth chart standards set forth by the Centers for Disease Control and Prevention to facilitate implementation into EHR systems.[14]
.jpg)
|
.jpg)
|
- Links: Trisomy 21
Prader-Willi Syndrome
Chromosome 15 |
Standardized growth curves for weight, length, head circumference, weight/length, and BMI for non-growth hormone-treated white infants (108 boys and 78 girls) with Prader-Willi syndrome (PWS) between 0 and 36 months of age. Five separate standardized growth curves (weight, length, head circumference, weight/length, and BMI) representing 7 percentile ranges were developed from 186 non-growth hormone-treated white male and female infants with PWS aged 0 to 36 months, and the normative 50th percentile was plotted on each standardized infant growth curve.[15] |
Williams Syndrome
The following data is from a paper producing a growth reference for British children with Williams syndrome.[16]
Female Height chart | Weight chart | Head circumference chart
Male Height chart | Weight chart | Head circumference chart
- Links: Williams Syndrome
Mowat-Wilson Syndrome
Mowat–Wilson syndrome (MWS; OMIM #235730) is a genetic condition caused by heterozygous mutations or deletions of the ZEB2 gene characterized by moderate-severe intellectual disability, epilepsy, Hirschsprung disease and multiple organ malformations (congenital heart defects and urogenital anomalies). Growth charts for males and females aged from 0 to 16 years have been generated using a total of 2865 measurements from 99 MWS patients of different ancestries. [4]
Growth Charts Program
Important Note: this program is based upon USA Clinical Growth Charts (2000) not the new WHO Child Growth Standards (2006).
Growth Charts version 1.1 by David Hanauer is based upon USA Clinical growth charts. A copy of the program is included on the Embryology CD. It can also be found in the EXTRAS folder on the CD the file is called "Growth_Charts.dmg.sit" and requires stuffit to decompress.
- "Growth Charts is a Macintosh OS X application that allows for tracking and charting of growth data for children/teens from birth through age 20 years. It can track weight, length/height, head circumference, and even body mass index (BMI). Using the program, data can be stored, edited, and subsequently plotted on growth charts. The growth charts come from the Centers for Disease Control (CDC) and are the same ones used by pediatricians throughout the United States to monitor for abnormal or concerning growth patterns. If you have ever been curious to follow the growth of your child (or yourself) the same way that the doctor does, this program will allow you to do that using the same charts that your doctor probably uses."
The original program can also be found at (http://www.supermagnus.com/mac/Growth_Charts) (Email: David Hanauer)
References
- ↑ WHO Multicentre Growth Reference Study Group. (2006). WHO Child Growth Standards based on length/height, weight and age. Acta Paediatr Suppl , 450, 76-85. PMID: 16817681
- ↑ Reddy VS, Jahagirdar R & Deshpande R. (2020). Growth Parameters of under 2-year-old Indian Children: A Comparison to WHO MGRS 2006 Charts. Indian J Endocrinol Metab , 24, 176-180. PMID: 32699786 DOI.
- ↑ Keller JA. (2020). Counting the Weighs: Growth Velocity Tables for Preterm Infants. Nutr Clin Pract , , . PMID: 32662526 DOI.
- ↑ 4.0 4.1 Ivanovski I, Djuric O, Broccoli S, Caraffi SG, Accorsi P, Adam MP, Avela K, Badura-Stronka M, Bayat A, Clayton-Smith J, Cocco I, Cordelli DM, Cuturilo G, Di Pisa V, Dupont Garcia J, Gastaldi R, Giordano L, Guala A, Hoei-Hansen C, Inaba M, Iodice A, Nielsen JEK, Kuburovic V, Lazalde-Medina B, Malbora B, Mizuno S, Moldovan O, Møller RS, Muschke P, Otelli V, Pantaleoni C, Piscopo C, Poch-Olive ML, Prpic I, Marín Reina P, Raviglione F, Ricci E, Scarano E, Simonte G, Smigiel R, Tanteles G, Tarani L, Trimouille A, Valera ET, Schrier Vergano S, Writzl K, Callewaert B, Savasta S, Street ME, Iughetti L, Bernasconi S, Giorgi Rossi P & Garavelli L. (2020). Mowat-Wilson syndrome: growth charts. Orphanet J Rare Dis , 15, 151. PMID: 32539836 DOI.
- ↑ 5.0 5.1 Wright CM, Williams AF, Elliman D, Bedford H, Birks E, Butler G, Sachs M, Moy RJ & Cole TJ. (2010). Using the new UK-WHO growth charts. BMJ , 340, c1140. PMID: 20231247
- ↑ Bois C, Servolin J & Guillemot G. (2010). [Monitoring infant growth: comparative use of WHO standards and French national reference curves]. Arch Pediatr , 17, 1035-41. PMID: 20488685 DOI.
- ↑ Ziegler EE & Nelson SE. (2010). Growth charts compared. Nestle Nutr Workshop Ser Pediatr Program , 65, 197-210; discussion 210-2. PMID: 20139683 DOI.
- ↑ Olsen IE, Groveman SA, Lawson ML, Clark RH & Zemel BS. (2010). New intrauterine growth curves based on United States data. Pediatrics , 125, e214-24. PMID: 20100760 DOI.
- ↑ Júlíusson PB, Roelants M, Hoppenbrouwers K, Hauspie R & Bjerknes R. (2011). Growth of Belgian and Norwegian children compared to the WHO growth standards: prevalence below -2 and above +2 SD and the effect of breastfeeding. Arch. Dis. Child. , 96, 916-21. PMID: 19948662 DOI.
- ↑ Cole TJ & Wright CM. (2011). A chart to predict adult height from a child's current height. Ann. Hum. Biol. , 38, 662-8. PMID: 21767107 DOI.
- ↑ 11.0 11.1 Li H, Ji CY, Zong XN & Zhang YQ. (2009). [Height and weight standardized growth charts for Chinese children and adolescents aged 0 to 18 years]. Zhonghua Er Ke Za Zhi , 47, 487-92. PMID: 19951507
- ↑ <pubmed>19951508</pubmed>
- ↑ Fenton TR. (2003). A new growth chart for preterm babies: Babson and Benda's chart updated with recent data and a new format. BMC Pediatr , 3, 13. PMID: 14678563 DOI.
- ↑ Rosenbloom ST, McGregor TL, Chen Q, An AQ, Hsu S & Dupont WD. (2010). Specialized Pediatric Growth Charts For Electronic Health Record Systems: the example of Down syndrome. AMIA Annu Symp Proc , 2010, 687-91. PMID: 21347066
- ↑ Butler MG, Sturich J, Lee J, Myers SE, Whitman BY, Gold JA, Kimonis V, Scheimann A, Terrazas N & Driscoll DJ. (2011). Growth standards of infants with Prader-Willi syndrome. Pediatrics , 127, 687-95. PMID: 21402637 DOI.
- ↑ Martin ND, Smith WR, Cole TJ & Preece MA. (2007). New height, weight and head circumference charts for British children with Williams syndrome. Arch. Dis. Child. , 92, 598-601. PMID: 17301110 DOI.
Reviews
Weaver LT. (2011). How did babies grow 100 years ago?. Eur J Clin Nutr , 65, 3-9. PMID: 21119695 DOI.
Siden H, Steele R, Brant R, Cadell S, Davies B, Straatman L, Widger K & Andrews GS. (2010). Designing and implementing a longitudinal study of children with neurological, genetic or metabolic conditions: charting the territory. BMC Pediatr , 10, 67. PMID: 20854664 DOI.
Papadimitriou A, Nicolaidou P, Fretzayas A & Chrousos GP. (2010). Clinical review: Constitutional advancement of growth, a.k.a. early growth acceleration, predicts early puberty and childhood obesity. J. Clin. Endocrinol. Metab. , 95, 4535-41. PMID: 20610589 DOI.
Articles
Reddy VS, Jahagirdar R & Deshpande R. (2020). Growth Parameters of under 2-year-old Indian Children: A Comparison to WHO MGRS 2006 Charts. Indian J Endocrinol Metab , 24, 176-180. PMID: 32699786 DOI.
Keller JA. (2020). Counting the Weighs: Growth Velocity Tables for Preterm Infants. Nutr Clin Pract , , . PMID: 32662526 DOI.
Gardosi J, Francis A, Turner S & Williams M. (2018). Customized growth charts: rationale, validation and clinical benefits. Am. J. Obstet. Gynecol. , 218, S609-S618. PMID: 29422203 DOI.
Landau-Crangle E, Rochow N, Fenton TR, Liu K, Ali A, So HY, Fusch G, Marrin ML & Fusch C. (2018). Individualized Postnatal Growth Trajectories for Preterm Infants. JPEN J Parenter Enteral Nutr , 42, 1084-1092. PMID: 29419902 DOI.
Villar J, Giuliani F, Bhutta ZA, Bertino E, Ohuma EO, Ismail LC, Barros FC, Altman DG, Victora C, Noble JA, Gravett MG, Purwar M, Pang R, Lambert A, Papageorghiou AT, Ochieng R, Jaffer YA & Kennedy SH. (2015). Postnatal growth standards for preterm infants: the Preterm Postnatal Follow-up Study of the INTERGROWTH-21(st) Project. Lancet Glob Health , 3, e681-91. PMID: 26475015 DOI.
Diekmann M, Genzel-Boroviczény O, Zoppelli L & von Poblotzki M. (2005). Postnatal growth curves for extremely low birth weight infants with early enteral nutrition. Eur. J. Pediatr. , 164, 714-23. PMID: 16151792 DOI.
Hack M, Schluchter M, Cartar L, Rahman M, Cuttler L & Borawski E. (2003). Growth of very low birth weight infants to age 20 years. Pediatrics , 112, e30-8. PMID: 12837903
Ehrenkranz RA, Younes N, Lemons JA, Fanaroff AA, Donovan EF, Wright LL, Katsikiotis V, Tyson JE, Oh W, Shankaran S, Bauer CR, Korones SB, Stoll BJ, Stevenson DK & Papile LA. (1999). Longitudinal growth of hospitalized very low birth weight infants. Pediatrics , 104, 280-9. PMID: 10429008
PMID 21286295 | PMC2865939
Search Pubmed
July 2011 "child growth chart" - All (1304) Review (82) Free Full Text (256)
Search Pubmed Now: child growth chart
Terms
- AGA - Appropriate for Gestational Age, term describing birth Height (Ht), weight (Wt), occipital-frontal circumference (OFC) at birth postnatal growth patterns.
- breast-fed infants - fed by maternal milk. These infants tend to gain weight more rapidly in the first 2 to 3 months, from 6 to 12 months breast-fed infants tend to weigh less than formula-fed infants.
- Percentiles - statistical term, rank the position of an individual by indicating what percent of the reference population the individual would equal or exceed. For example, on the weight-for-age growth charts, a 5-year-old girl whose weight is at the 25th percentile, weighs the same or more than 25 percent of the reference population of 5-year-old girls, and weighs less than 75 percent of the 5-year-old girls in the reference population.
- SGA - Small for Gestational Age, term describing birth Height (Ht), weight (Wt), occipital-frontal circumference (OFC) at birth postnatal growth patterns.
- z-score - statistical term, for the deviation of the value for an individual from the mean value of the reference population divided by the standard deviation for the reference population. Because z-scores have a direct relationship with percentiles, a conversion can occur in either direction using a standard normal distribution table. Therefore, for every z-score there is a corresponding percentile and vice versa.
(some text modified from CDC Growthchart FAQ)
External Links
External Links Notice - The dynamic nature of the internet may mean that some of these listed links may no longer function. If the link no longer works search the web with the link text or name. Links to any external commercial sites are provided for information purposes only and should never be considered an endorsement. UNSW Embryology is provided as an educational resource with no clinical information or commercial affiliation.
- World Health Organization (WHO) Fact Sheets This page is being updated to include the WHO Growth Chart (Apr 2006) information.
- United Kingdom
- United States United States Clinical Growth Charts
- Australian Growth Charts - link not available.
- Canada
- Growth Charts version 1.1 by David Hanauer based upon USA Clinical growth charts which is included on the Embryology CD. The original program can also be found at (Version 1.2.2 http://www.supermagnus.com/mac/Growth_Charts/)
- MedCalc: Interactive Growth Charts An online commercial growth calculator (Caution- data used for calculations is not stipulated)
- Growth Charts for Chineses Children
- Korean Growth Charts
- STAT program calculates growth percentiles based on the June 2000 revision of the CDC Growth Charts for the United States.
- Trisomy 21
- Growth Charts for Children with Cerebral Palsy
| Statistics Links: Introduction | Reports | World Population | World Fertility | World Infant Mortality | Maternal Mortality | Australia | Brazil | Canada | China | Germany | India | Indonesia | Europe | Myanmar | Netherlands | Spain | United Kingdom | Romania | Uganda | United States | BGD Tutorial - Applied Embryology and Teratology | National Perinatal Statistics Unit | AIHW | Category:Statistics | |
|
Glossary Links
- Glossary: A | B | C | D | E | F | G | H | I | J | K | L | M | N | O | P | Q | R | S | T | U | V | W | X | Y | Z | Numbers | Symbols | Term Link
Cite this page: Hill, M.A. (2024, April 16) Embryology Postnatal - Growth Charts. Retrieved from https://embryology.med.unsw.edu.au/embryology/index.php/Postnatal_-_Growth_Charts
- © Dr Mark Hill 2024, UNSW Embryology ISBN: 978 0 7334 2609 4 - UNSW CRICOS Provider Code No. 00098G