File:Mouse ethanol exposure face changes PMID22937012.jpg

Original file (1,200 × 859 pixels, file size: 238 KB, MIME type: image/jpeg)
Mouse Face Phenotypes following Ethanol Exposure
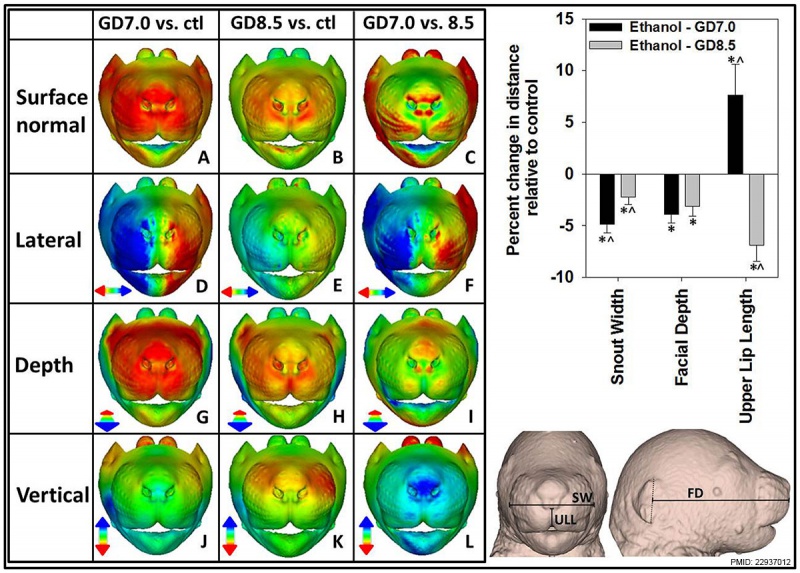
Dense surface modeling illustrates unique facial phenotypes resulting from stage-specific ethanol exposure.
(Left) Mean surface shape of the GD7 and GD8.5 exposure groups relative to the control group is shown in the first and second columns respectively, while the GD7 group is directly compared to the GD8.5 ethanol-exposed group in the third column. (A–C) Color-map comparisons reflecting the displacement of mean surface shape for the indicated groups, where red indicates regions most distant and internal, while blue indicates regions most distant and external. Other colors shown in the scales identify intermediate positions. (D–L) Color-map comparisons reflecting the displacement of the indicated mean surface shapes parallel to the three orthogonal axes. Red and blue color intensities reflect displacement in the direction indicated by the corresponding color-coded arrow. Changes are shown at a scale of 1.2 standard deviations. (Right) Snout width (SW) was measured between the most lateral 3rd row of vibrissae; Median upper lip length (ULL) was measured from the lower edge of the nostrils to the bottom of the upper lip; Facial depth (FD) was measured from the middle of the ear to the top of the philtrum. Values represent the means + the S.E.M. *p<0.05 compared to control group. ∧p<0.05 compared to counterpart ethanol exposure group.
- Links: Fetal Alcohol Syndrome | Prof Kathy Sulik
Reference
<pubmed>22937012</pubmed>| PLoS One.
Copyright
© Lipinski et al. This is an open-access article distributed under the terms of the Creative Commons Attribution License, which permits unrestricted use, distribution, and reproduction in any medium, provided the original author and source are credited.
Figure 2. doi:10.1371/journal.pone.0043067.g002
Cite this page: Hill, M.A. (2024, April 26) Embryology Mouse ethanol exposure face changes PMID22937012.jpg. Retrieved from https://embryology.med.unsw.edu.au/embryology/index.php/File:Mouse_ethanol_exposure_face_changes_PMID22937012.jpg
- © Dr Mark Hill 2024, UNSW Embryology ISBN: 978 0 7334 2609 4 - UNSW CRICOS Provider Code No. 00098G
File history
Click on a date/time to view the file as it appeared at that time.
| Date/Time | Thumbnail | Dimensions | User | Comment | |
|---|---|---|---|---|---|
| current | 09:58, 3 June 2014 |  | 1,200 × 859 (238 KB) | Z8600021 (talk | contribs) | ==Mouse Face Phenotypes following Ethanol Exposure== Dense surface modeling illustrates unique facial phenotypes resulting from stage-specific ethanol exposure. (Left) Mean surface shape of the GD7 and GD8.5 exposure groups relative to the control g... |
You cannot overwrite this file.
File usage
The following 2 pages use this file: